
Introduction
Requirements for the e-balance creation
The specific, accounting and taxes software, from which data should be used in the electronic reports must have an export interface for the balance information. This account / position balances can be imported to the Reportfactory - the sum of taxonomy positions are calculated automatically. As export format CSV formats are supported. With importing CSV data the individual settings of the feeder system can be took with through selecting its information in the data import dialog . The creation process of an e- balance sheet is supported by a multi-purpose tool collection , so very different conditions and specific requirements of the data receiver are checked carefully.
Product video
For an easy overview, you can watch our product video.
Functional view
-
Transmission types: trade balance with reconciliation or tax accounting
-
Creation of the accounting reconciliation, through external changes / reclassifications, or by linking the data in Excel-based reconciliations
-
Preparing financial statements or multiple statements (for example, daughters or property companies) in a report project
-
Unified account assignments or heterogeneous account assignments in a report project
-
Integration of a general ledger and optional multiple sub-ledger systems
-
Regardless of the architecture in the feeder system: A booking circle / parallel booking circles / parallel accounts / parallel ledgers
-
Automated calculation of total positions by balances import, manual collection of data, or combination of both
-
Rebookings / reclassifications outside of the financial accounting / ERP are possible
-
Use predefined collection forms or preparation of individual forms
-
Special editor for positions with formatted text, format adjustment in accordance with the receiver requirements (for example, E-Balance Interface Specification)
-
Support Elster requirements (reasonability rules etc.)
-
XBRL inside! The entire data management is XBRL standard compliant. Support of arbitrary, individually extended taxonomies
The ReportFactory is available as a stand-alone system or a multi-user system. Using the single-user system, the installed software can be used by one user. For this, the software must be installed on the same computer, the user wants to access the ReportFactory.
If the ReportFactory was installed as a multi-user system, multiple remote users can access to the server software at the same time. In multi-user systems, the tasks can be assigned to specific users during the report creation process (authorization concept)
The E-Bilanz Addin extends the functionality of the ReportFactory to special functions which facilitate the creation of e-balances and checks the specific requirements of the recipient (German tax authorities) account. With the E-Bilanz Addin the transfer interface of the tax authorities is used (ERiC - Elster Rich Client). The Addin includes a plausibility and transmission component for the submission of e-balance sheets, which can be used for pilot and test case submissions and for real-case submissions since May 2012.
Technical system requirements
The user interface of the ReportFactory can be used in a web browser. The Internet browser uses the web service of the ReportFactory server . The ReportFactory server is java-based and referring to this, platform independent . In addition to the Internet browser, the ReportFactory can be used out of MS Office. The Office Addins communicate with the report Factory Server via a web interface. For the transmission of e- balances a software component of the financial management has been integrated into the software itself. The so-called ERiC ( Elster Rich Client ) can be run only on the operating systems Windows and Linux .
ReportFactory Server
-
Platform independent (100% Java or Java 8)
-
1925 MB free disk space
-
4096 MB RAM (size depends on how many taxonomies are used).
Browser Client
-
Google Chrome
-
Microsoft Edge
-
Firefox 3.xx (minimum)
-
other (like Opera)
MS Excel
-
MS Excel 2010, MS Excel 2013
-
Windows 7, Windows 8, Windows 8.1, Windows 10
ERiC
-
Windows 7, Windows 8, Windows 8.1, Windows 10, Windows Server 2008, Windows Server 2012 (WinRT API is not supported), Windows Server 2016, Windows Server 2019 or Windows Server 2022. For every Windows-Version the latest Security-Updates is required.
-
Linux, (minimum) LSB 4.1 certified distribution. The ERiC team has tested following: Debian 9 LTS, Debian 10 LTS, Ubuntu 16.04 LTS, Ubuntu 18.04 LTS, SUSE Linux Enterprise Server 12, SUSE Linux Enterprise Server 15, Red Hat Enterprise Linux 6, Red Hat Enterprise Linux 7, Red Hat Enterprise Linux 8
-
Internet connection to port 443 to the domains datenannahme1.elster.de, datenannahme2.elster.de, datenannahme3.elster.de, datenannahme4.elster.de via https
Installation and starting of ReportFactory
Installation instructions
The Report Factory is delivered either as a stand-alone version or as a multi-user version. The license key file that is delivered in addition to the software package for installation contains information, whether it is a single user or a multi-user version. In the case of a multi-user version, the license key file also contains an indication of the number of users.
The ReportFactory can be installed under Windows with an installer or can be integrated in Windows and other operating systems as an application in an existing web server (Deployment of .war file).
The installation with the Windows installer is usually used in the single-user version, for the multi-user version or installation on other operating systems, the deployment is recommended in a Web server. In principle, users of the reportfactory can freely decide which of the two types of installation they want to use.
Please read the installation manual to learn more about the installation details or the specific implementation.
[.aui-icon .aui-icon-small .aui-iconfont-info .confluence-information-macro-icon]##
When you launch the ReportFactory for the first time a default-user is created. Username and password are documented in the installation guide.
Starting after standalone installation through the windows installer
If your ReportFactory was not installed with the Windows Installer, please continue with the next section! There you will find the instructions for access the ReportFactory when it is installed in a Web server.
The ReportFactory is a browser-based application that, apart from the Office Addins, can be handled through most common internet browsers.
| Please do not close the console window! This would sto executing the report Factory. The console window can be minimized, if it interferes with the work on the desktop. Report Factory is stopped by clicking “Stop”. |
There are two user areas: If you have administrator rights, you can access the administration area to manage the users of RF. In the general user-interface, all users – which have been created through the admin – can create report projects and work on their specific report jobs.
The admin area can be loaded by selecting “Report Factory Administration” in the Internet browser installed on the system. If there are problems starting the Internet browser, you can also launch the browser manually and enter the following address:
The user interface can be accessed analogue either by calling “Report Factory interface” or by entering the following address in your browser:
After calling the browser address a login screen appears.

After logging in, the user menu appears.
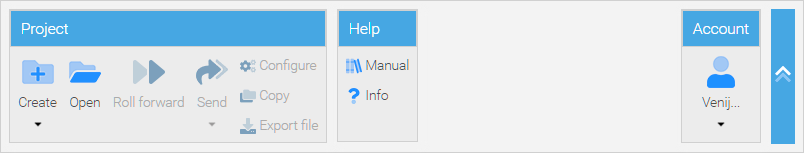
In the upper right corner, the user name of the logged in user is displayed (here “Administrator”).
If you have not logged out after you have used the report Factory the last time and your Internet browser has stored the credentials, it can be that the login menu will be skipped and the user menu of the Report Factory is displayed directly.
Starting after installation on a webserver
There are two user areas: If you have administrator rights, you can access the administration area to manage the users of RF. In the general user-interface, all users – which have been created through the admin – can create report projects and work on their specific report jobs.
The admin area can be loaded by calling an address in the Internet browser. The URL of the call depends on the address of the server on which the ReportFactory is installed. The start address has the following structure:
<server:port>/reportfactory/admin
The user interface can be accessed by entering the following address in your browser:
<server:port>//reportfactory
Please check with your system administrator the server address <server: port> for calling the ReportFactory!
After calling the browser address a login screen appears.
After logging in, the user menu appears.
In the upper right corner, the user name of the logged in user is displayed (here “Administrator”).
If you have not logged out when you last used the report Factory and your Internet browser has stored the credentials, it may be that the application form will be skipped and the user menu of the Report Factory is displayed directly.
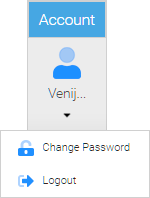
Password change/logout
To change the password, a user must be logged in. The user menu on the top right offers the following two functions:
-
Change Password
-
Logout
To change the password, please proceed as follows:
Select the menu item “Change Password”. Then the following menu
appears:
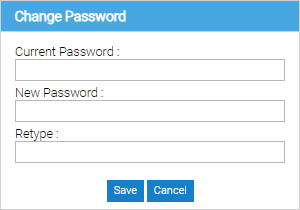
“Current Password” - Please type here your old password, which shall be changed. Now enter in the input fields “New Password” and “Password repeat” the new password. Then confirm the entry by pressing the OK button.
To log out, select the user menu and select “Logout”.Then the login dialog appears again and re-login.
| Please note that the registration information is stored by your Internet browser. Therefore, you should logout after you have finished your work to ensure that no other user can access the ReportFactory from your computer without authorization. |
Create an user account in a multi-user version
If you do not have administration rights for RF, you can skip this section!
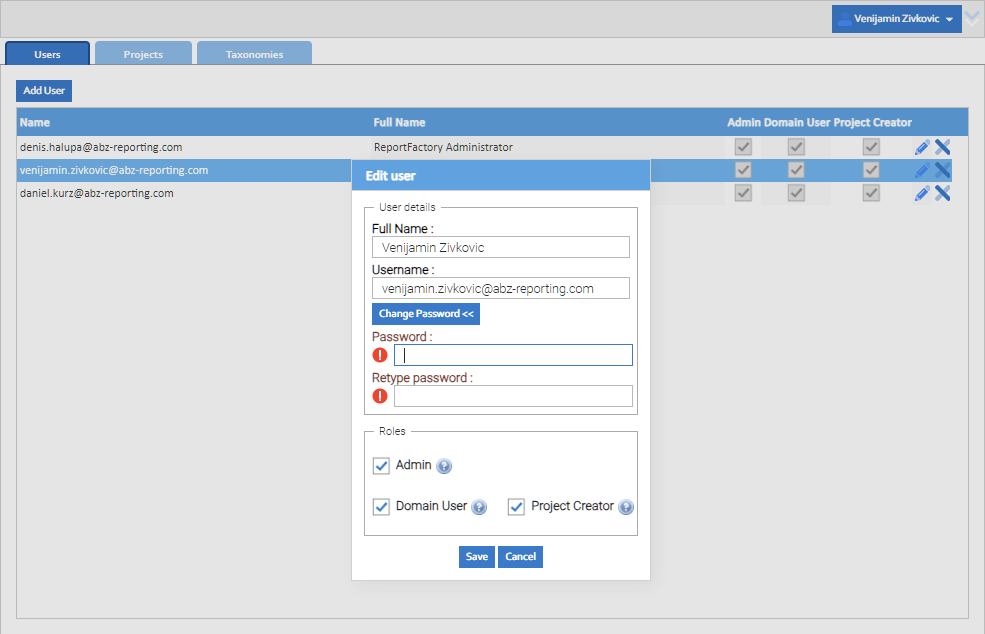
In The administration area users are created and managed. A user must be assigned a login name, a real name and a password. New users are defined by clicking the “Add User” button.
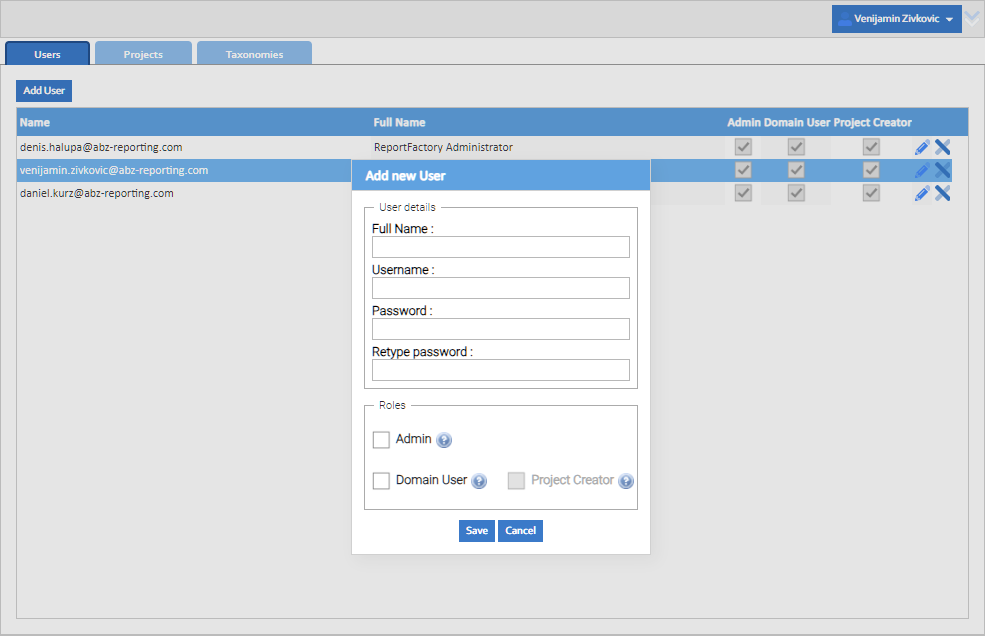
In addition, three user roles can be assigned:
-
By placing a hook in the check box for the administrator role a user has administrator privileges. An administrator has the permission to access the administration section of the RF. Therefore he has the authorization to create new users or delete users.
-
By placing a hook in the check box for the domain user role a user is authorized to work on report projects. Only a domain user can be assigned with rights in report projects.
-
By placing a hook in the check box for the project creator role, a user is authorized to create report projects. In the report projects created by yourself a user has all permissions for the use of various reporting features and in addition individual permissions can be given to other users.
| Only users who have the “domain user role” are restricted by the license quota. If a user has no assigned role, the user has no rights. A user without a role can be regarded as a disabled user. In Conclusion a user can loose its permissions (temporarily) by removing its roles. |
Manage existing users by clicking on the “pencil” button.
Proxy Setup for the ERIC client transmission
The ERiC client makes an internet connection for the transmission of e-balance on port 443 to one of the domains
-
Datenannahme1.elster.de
-
Datenannahme2.elster.de
-
Datenannahme3.elster.de
-
Datenannahme4.elster.de
by https.
The settings to use a proxy for the ERiC client transmissions are made in the configuration file config.properties.
The config.properties is placed in the user data directory of the ReportFactory. An installation through using the installer this is by default C:\Program Data\ ABZ Reporting\Report Factory.
| Changes to the config.properties file only become effective after a restart of the ReportFactory server. |
Parameters
The following parameters can be set:
| Parameter name | Type | Example value | Description |
|---|---|---|---|
reportfactory.http.proxy.auth |
String |
127.0.0.1 |
(IP) address or host name of the proxy |
reportfactory.http.proxy.port |
String |
3128 |
Proxy-Port |
reportfactory.http.proxy.username |
String |
Test |
Password for proxy authentication |
reportfactory.http.proxy.password |
String |
123456 |
(IP) address or host name of the proxy |
reportfactory.http.proxy.auth |
String |
any |
Is optional; Valid values:AnyBasicDigestGSSNTLMDigestIEStandard: anyMultiple values have to be separated by commas. The uppercase / lowercase of the value is ignored. |
Configuration examples
reportfactory.http.proxy.host=127.0.0.1

reportfactory.http.proxy.port=3128

reportfactory.http.proxy.username=Test

reportfactory.http.proxy.password=123456

reportfactory.http.proxy.auth=any
Account mappings creation
With the menu item “account mappings” in the “Ledgers” menu, mappings to taxonomy positions can be made, relating to the balance lists created in the project configuration. The assignments of accounts to positions serves to calculate the balances of the positions, while:
-
account balances from all accounts assigned to a position determine the position balance
-
the position balances of total positions, which consist of balances of the subpositions, are calculated.
The calculation of position balances for all clients in a list is performed by the function “Generate facts”. So the mapping of accounts to positions only determines the type of calculation. The actual calculation / updating of position balances is performed by pressing the button “Generate facts” on the top left in the toolbar.
The account mappings of balance lists apply to all clients of this Balance list. The account mappings therefore must be created only once and then it can be used for all clients for which the balance list has been configured.
| Because in a balance list not only account balances, but also position balances can be imported from feeder systems, the term account mapping is actually too narrow. Since in most cases, account balances are imported and the assignment of accounts to positions is a typical activity in the preparation of financial statements, the term account mapping and not general “account or position mapping” was used. |
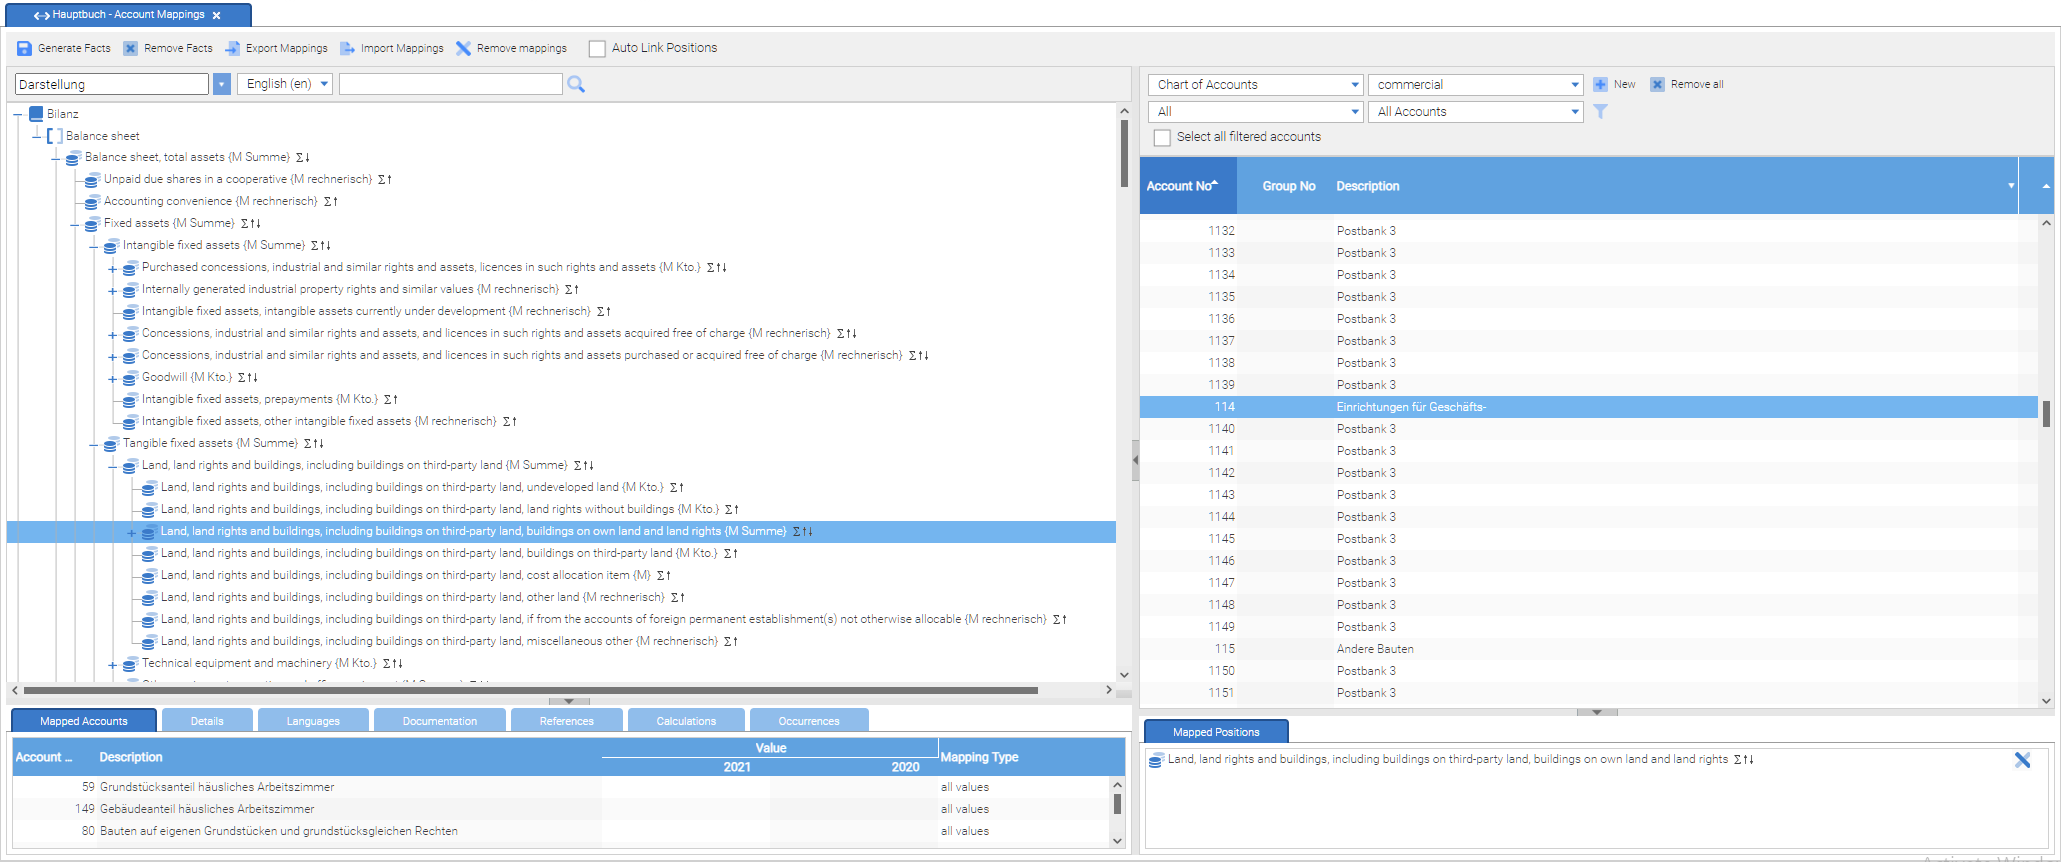
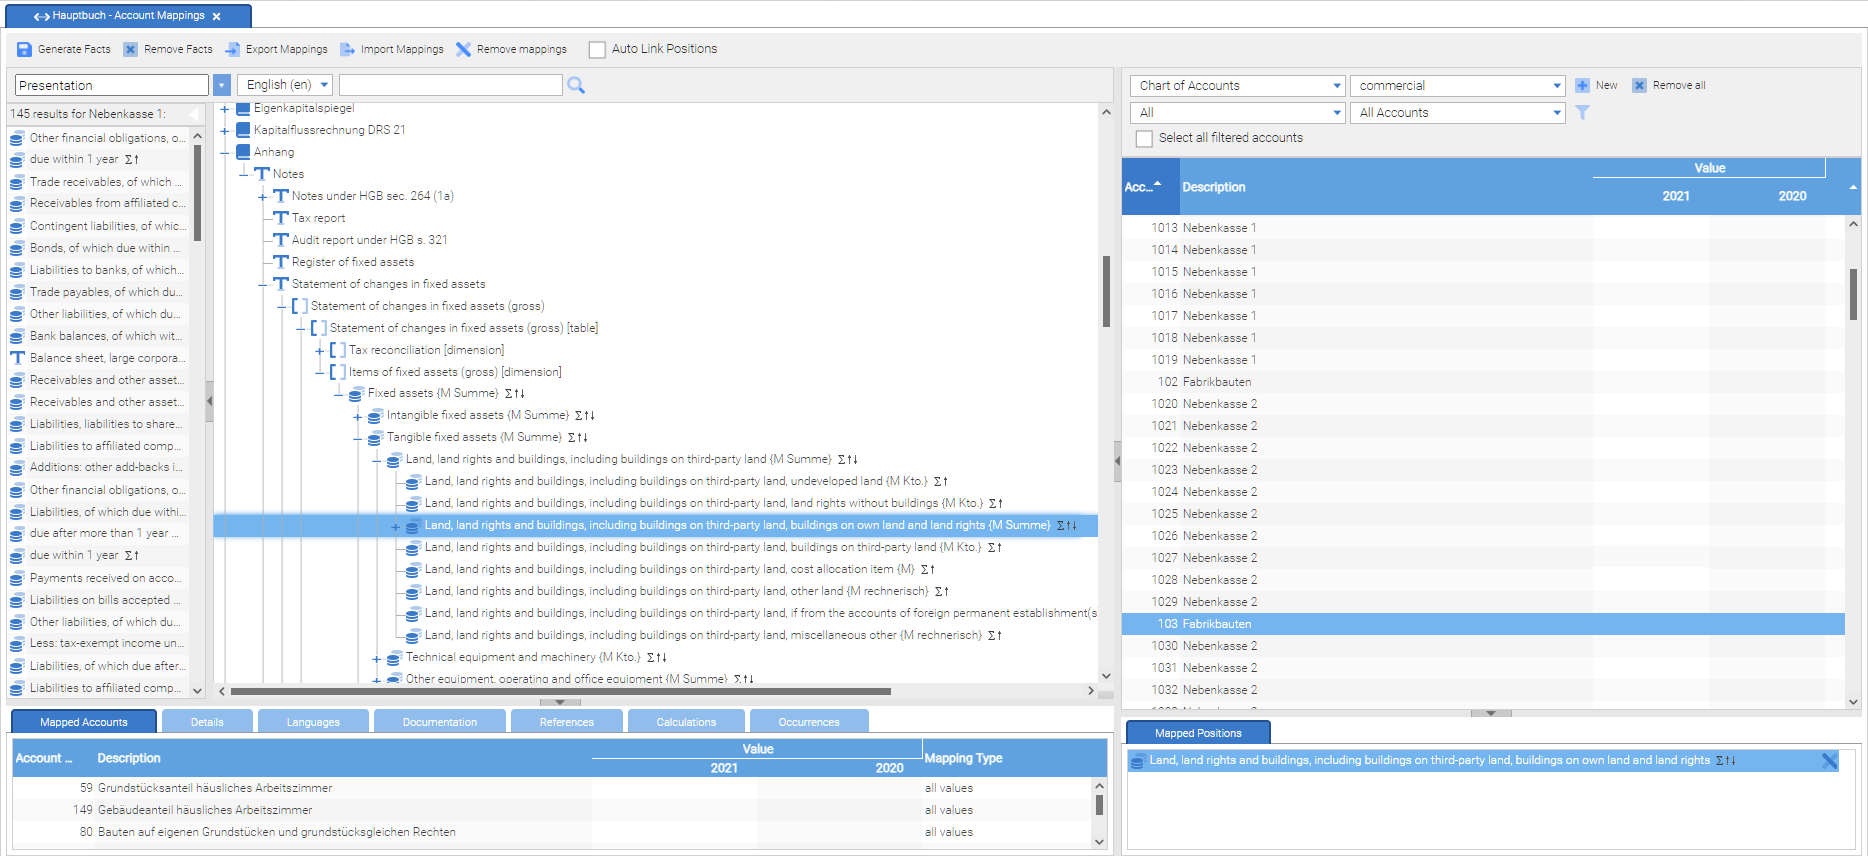
The user interface for creating account assignments is divided into two areas:
On the left side, the structure of the taxonomy appears at the top. Subpositions can be collapsed by mouse click on the “+” and “-”. In the window on the left details are displayed for the positions of the taxonomy. Of particular importance for creating account assignments is the tab “Assigned accounts”. Here the accounts that have been assigned to the currently selected taxonomy position, are displayed.
On the right side the accounts and / or account balances are displayed. By selecting “chart of accounts” in the selection list in the top left, the imported chart of accounts appears. If no chart of account was imported, the selection is empty. By selecting individual clients in the same selection list, the imported accounts are displayed under the respective client. If for a client no balances have been imported, the list is empty. The representation of a balance list for a client is different from the one for a chart of account by a additional display of balances for one or more periods. In the lower right window taxonomy positions are displayed, where an account has been assigned. In practice, an account is often associated with only one position. However, it may also be necessary to assign an account to a number of positions, for example, if the balance of a of-which-position has to be calculated. Of-which-positions are in XBRL taxonomies mathematically not connected to parent positions, so that the balance of the associated account is not automatically transferred to the higher-level position. Another example is the use of types of assignments, in which an account balance is assigned to an essets or liabilities position.
Account assignments are created by drawing an account (or multiple accounts) from the right side (balances list) to a position of the left side using drag and drop. The result of the mapping is then the tab “Assigned accounts” - visible on the bottom left.
Account assignments are removed by field click on the “cross” icon in the “Assigned position”.
The following sections describe the individual functions for creating account assignments detail.
General view of the menu functions
Functions are offered in two toolbars for creating the account mappings.

With the top toolbar, facts can be generated and deleted based of the existing account assignments. The functions “Generate facts” and “Remove facts” are always applied for all clients of one balance list.
It is also possible to export account assignments in a CSV file or import existing account assignments from a CSV file.
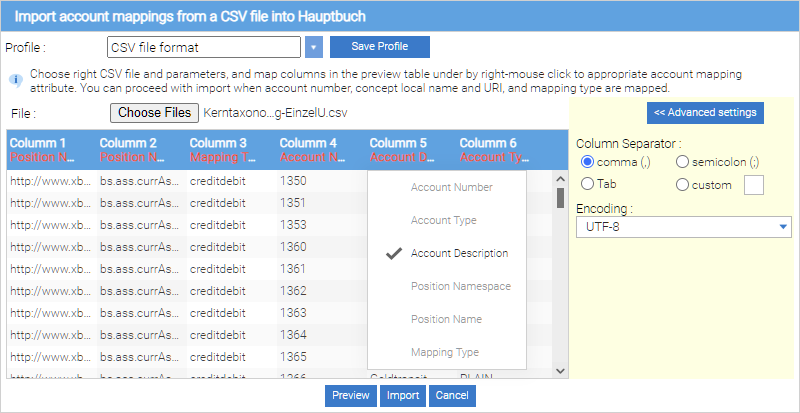
There are several reasons to back up the account assignments in a CSV file, for example to hold the current version of an account assignment or to take over the account assignments to other account balances or projects. If account assignments that were exported with the report Factory, shall be imported, then the user (chart of accounts or balances Import) has not to care about the specific CSV settings.
If the account assignments were created in a third-party software (for example, MS Excel), then similar settings as the other CSV import options can be made for importing the assignments.
The figure below shows the settings:
-
Column separator
-
Encoding
-
File
-
Column mappings
-
Namespace of the position
-
Name of the position
-
Account Assignment Type
-
Account number
-
Account Description
-
With the “Remove account assignments” button all account assignments of the balance list are removed. It is recommended, before deleting the account assignments, to export them first. If the deletion of the account assignment would lead to an unexpected result, then the account assignments can be imported back and thus the original state will be restored.
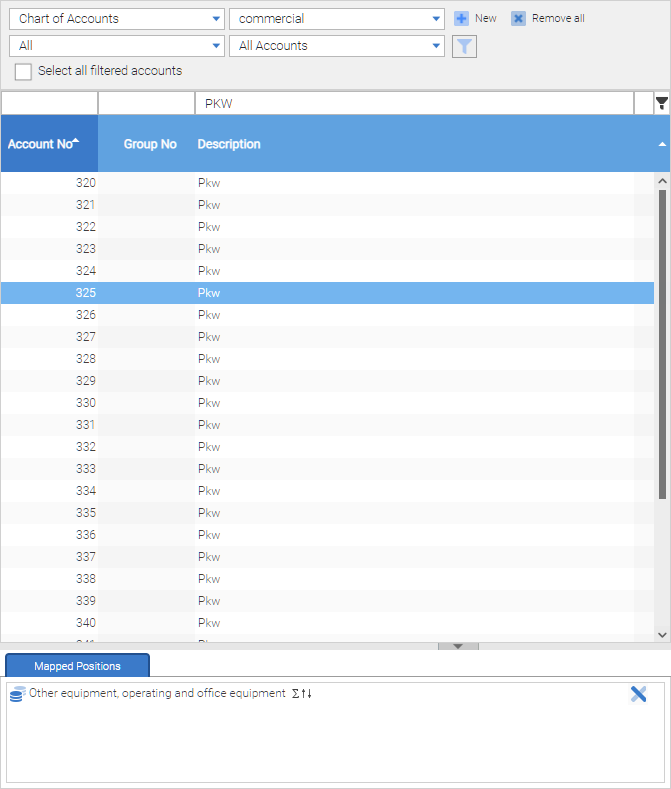
The second toolbar on the right side contains two selection lists and two buttons.
The first drop-down list allows you to toggle between the display of the entire chart of accounts and the presentation of individual account balances for a single client.
| Regardless of whether the presentation of the entire chart of account or a single client is selected, changes to the account assignments are always effective for all clients of the Balance list! |
With the second selection list the presentation of the balance list between commercial balances and fiscal balances of a client can be switched. When the form of presentation “chart of accounts” was selected, then changing the settings in the selection list “commercial law / tax” will not affect the appearance of the Chart of Accounts.

Pressing the “New” button displays a selection with the entries “synthetic account” and “Account Group”.
Pressing the selection “synthetic Account”, a new (synthetic) account be created. This account is also added to the imported accounts and provided with a zero balance. Synthetic accounts can be filled with values by rebookings / reclassifications. They can be used in order to divide the balance of an account to multiple accounts.
Pressing the selection “Group account” a new group account can be created. In a group of accounts multiple accounts can be combined and can be assigned as a single account.
| Through an account group assigning, a set of accounts in different positions can be implemented based on the amount of your total. |
With the “Remove All” button all accounts of a chart of accounts or balances of a client will be deleted. This clearing operation only affects the respective selection in the two drop down menus on the left. If, for example, in the first selection list, the value “accounting system” and in the second selection list the value “commercial law” is selected, then only the commercial law chart of accounts is removed. The tax accounting system is preserved, and also not imported lists of account balances (both commercial law and tax) will be deleted.
| Pressing the button “Remove All” , all imported account balances of a client will be deleted. If in the left selection list instead of a client the general “chart of account” is selected, then the accounting system is deleted - the imported balances of individual clients remain however obtained. |
Change of balances visualization
The list of imported chart of accounts and the imported balances on the
right side can be individually adapted. If you click with the right
mouse button on the header of the table grid, this context menu
appears:
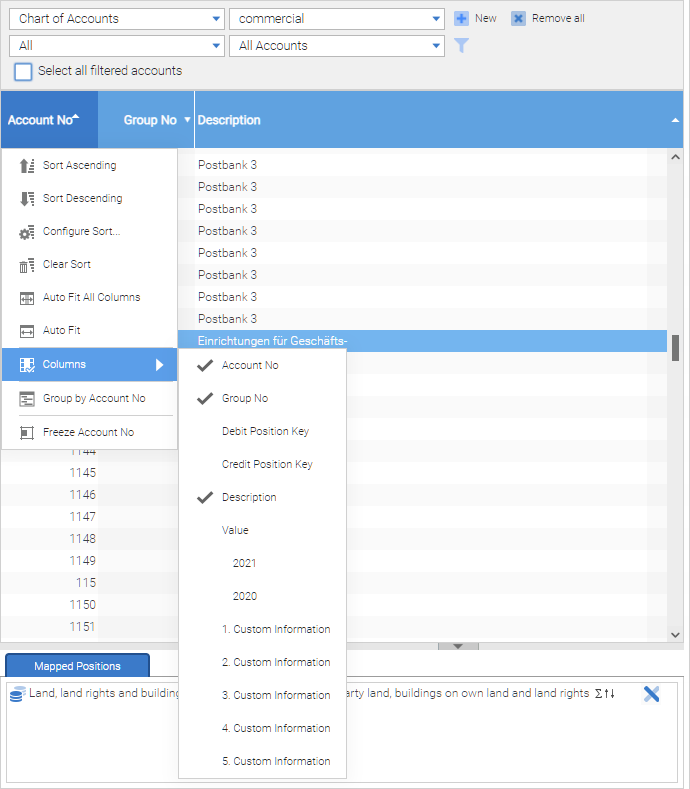
With the context menu imported columns can be sorted and shown or hided. Certain columns can also be grouped so that multiple lines are grouped based on a key. When a Position Key was imported from a source system, this easifies the classification of accounts usually quite serious. In this case it would be advantageous, to adjust the appearance of the table, that one or both position key columns for the display are activated.
Assigning accounts to group accounts
The assignment of accounts to a group of accounts is made by entering the number of the group account in the column “Group no”. The account that was assigned to a group of accounts is offset by double-clicking the account line in the edit mode. Thereafter -in the cell of the column “Group no.”- enter the number of the account group and confirm by pressing the “Return” key.
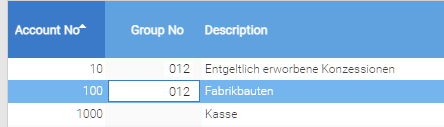
To remove the assignment of an account to an account group, the account is brought again in the editing mode, then the content of the cell in the column “Group no `" is deleted and confirmed by pressing the "`Return” key.
| The column “Group no.” is not displayed initialy. To show the column, see section “Change balances representation”. |
Assigning accounts to a position
The assignment of one or more accounts to a position is done by marking the positions (by pressing the left mouse button when the mouse is located over the account) and then drawing one of the selected accounts by simply dragging it to the target position.
The marking of multiple accounts is simplified by the following key combinations:
Selection of a list of accounts:
-
Mark the first account of the selection by pressing the left mouse button
-
Press the Shift key (Shift) and
-
simultaneously marking the last account of the selection with the left mouse button
Select multiple individual (non-contiguous) accounts
-
Mark an account of the selection by pressing the left mouse button,
-
Pressing the control key (Ctrl) and
-
simultaneous marking additional accounts using the left mouse button while the Control key is pressed
Define mapping type
After an account of a position has been assigned, you can specify in the details tab “Mapped accounts” the assignment type for the account. When mapping the type can be set in different value ranges for the account balance. If a specific account balance is in the range of the mapping type, then the balance will be included in the calculation of the target position. If the account balance is out of range, then it does not flow into the calculation of the balance of the position.
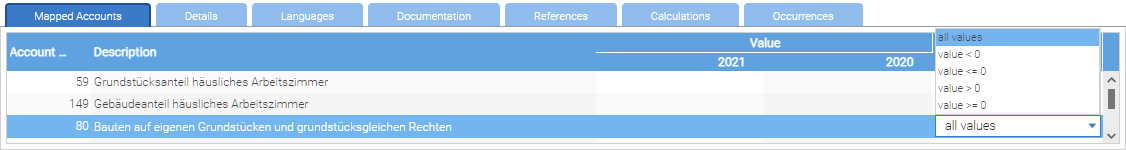
| In general, the balances of nominal positions have a positive value and the balances of credit positions a negative value. But if, for example, a receivables account shall be associated with a negative value of liabilities position, then this account must assigned to a position in the region demands “value> = 0” and additional to a position in the category liabilities with the assignment type “value <0”. |
Auto link
In addition to the selection of multiple accounts, there are two further options to assign multiple accounts to a target position.
The activation of the control box “Auto link”. Position assignment “in the top toolbar on the right, leads to not that, that not only a single account is associated with drag and drop to a target position. Rather, in addition, all other accounts that have the same position key, will be assigned to the target position.
By selecting the accounts, the Position key is distinguished by debit and credit position keys. If an account is assigned to a target position, all accounts are automatically assigned to the same target position key. If there is a credit position in the target position, it is used in accordance with the credit position key. Since the source systems do not always distinguish between credit and debit position key, but use general position keys, it can be considered to the effect during data import, that the key column two properties “debit key” and “credit key” is assigned.
| Please proceed with the activation or deactivation of the control box "`Auto. Position assignment `" to carefully to avoid unintentional assigning of accounts! |
Filter functions
The lower right toolbar contains various filter functions that are described below.
With the left selection list, the representation of the accounts can be restricted to types of accounts. By selecting “All”, no filtering of accounts is made, and all accounts are displayed. To reduce the display of accounts, there exist the following selections:
-
Account Groups: Shows the list of accounts only account groups
-
Synthetic Accounts: Shows in the list of accounts only synthetic accounts
-
Ungrouped Accounts: Shows in the accounts list only accounts that are not assigned to an account group
-
Grouped Accounts: Shows in the accounts list only accounts that are assigned to a group of accounts
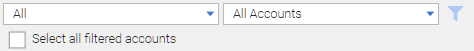
With the right selection list, the presentation of the accounts may also be limited. By selecting “All accounts” no filtering of accounts is made or all accounts are displayed. To reduce the display of accounts exist the following selections:
-
Unallocated accounts: Shows only accounts that were not assigned to any position
-
Assigned Accounts: Shows only accounts that have been assigned to one or more positions
-
Multiple assigned accounts: Shows only accounts that have been assigned to at least two positions
When creating an initial account assignment, the filter setting “Unallocated accounts” is recommended because remapped accounts automatically disappear from the list after the assignment. Thus, users have the ability to successively process all accounts - the list of unallocated accounts is empty.
The filter “multiple assigned accounts” can help to determine the cause, because a multi-assigned account may have been accidentally assigned to several target positions because through a change of assignment you forget to delete the old assignment.
Pressing the Filter button (rightmost icon), the rows are filtered in the table view. With the toolbar fields or columns of a balance list are displayed or hidden. In the fields terms can be entered to display only the rows that contain a search term.
In the figure only accounts appear that contain the phrase “A F A”.
“Select all filtered accounts” - With the control box all filtered accounts are selected and can be assigned by drag and drop to a target position. This feature is especially useful when the search criterion in many accounts remain as a filter result, but should be allocated completely to a position. In this case, a cumbersome selecting of these positions is prevented by the use of the control box.
How to filter the taxonomy view
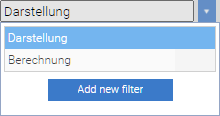
The report Factory provides the ability to display the taxonomy for filtering specific position properties. For this purpose, the left selection box on the taxonomy view, is expanded by pressing the icon.

Here are always the two built-in views “presentation” and “calculating” available. The selection list can be supplemented by additional custom views.
“Add New Filter” Pressing the button opens the dialog to define a filtered taxonomy view.
In the following dialogue the filtered taxonomy view is assigned with a name. Under this name the filtered taxonomy view is available after saving in the selection list of taxonomy views.
With the option “visible to all project members”, the filtered Taxonomiesicht is available to all users of the project. If in addition the “Project default” option is selected, then this filter is used - for all users of the project - as a presentation preset of the taxonomy.
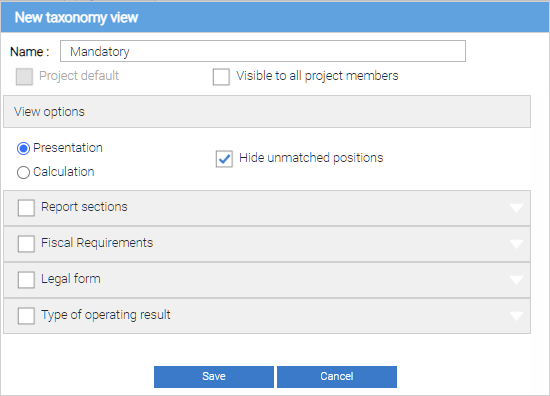
The first option for the filter is to select the presentation or calculation view (Presentation or Calculation hierarchy) as the standard of the taxonomy view.
The option “Hide unmatched positions” reduces the view of the positions with the desired properties. Otherwise, the positions are displayed, but not marked by a symbol.
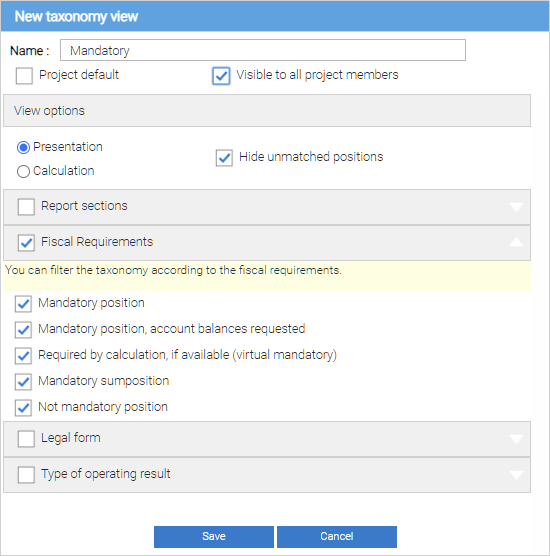
The various filter criteria are:
-
Report sections - is showing positions of selected parts of the report.
-
Tax mandatory - is showing positions of selected Required field types.
-
Legal form - is showing positions of selected legal forms (corporation, partnership, sole proprietor).
-
Statement format - is showing positions of selected income investigation (GKV, UCT).
-
Industry - There are only positions of the selected branch, which is displayed (Ergänzungsbranchentaxonomie only).
-
Insurance types - Only positions of the selected insurer types are displayed (only Spezialtaxonomie insurer).
-
Credit and financial services types - Only positions of the selected credit and financial service types are displayed (only Special taxonomy banks).
The filter criteria can be combined so that the taxonomy view only contains the relevant items for the current application.
By pressing the “Save” button, the settings for the filtered taxonomy view are stored and filtered.
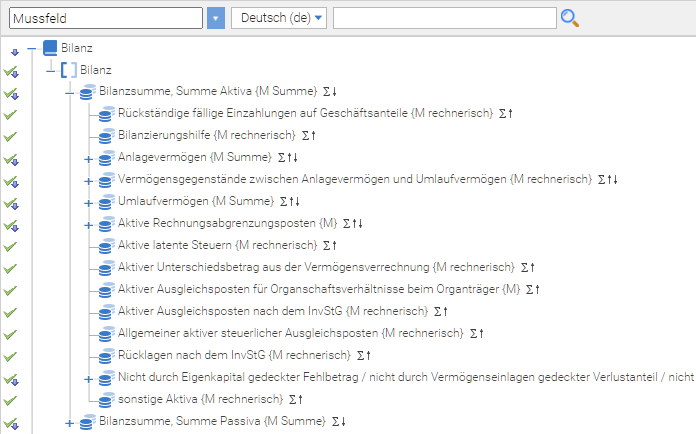
The icons on the left indicate the filter status of the corresponding position.
The symbol  means that the line is not affected by the filter, but a position below
exists that match the filter criteria.
means that the line is not affected by the filter, but a position below
exists that match the filter criteria.
The symbol  means that the positioni s corresponding
to the in the line to the filter criteria.
means that the positioni s corresponding
to the in the line to the filter criteria.
The symbol  means
that the position is in the line with the filter criteria and that
positions below exist that also meet the filter criteria.
means
that the position is in the line with the filter criteria and that
positions below exist that also meet the filter criteria.
Filter with the setting “Visible to all project members” are exported when exporting project, filters without that setting will not be exported.
Search functions
The Search for taxonomy views is facilitated by two search functions.
The accounts describtion in a list on the right balances can be used as a search term for a full text search in the taxonomy. The full text search is accessed by pressing the magnifying glass icon when the mouse pointer is over an account record.
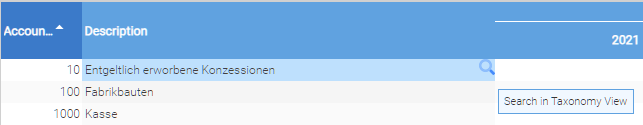
To perform the search, in the above example, the account description “Land and buildings” is used as a term for the taxonomy view and the search results area (left to the taxonomy structure) shows the taxonomy positions found in a list:
By double-clicking on a position, it is expanded in the structure on the left side and marked as a currently selected position.
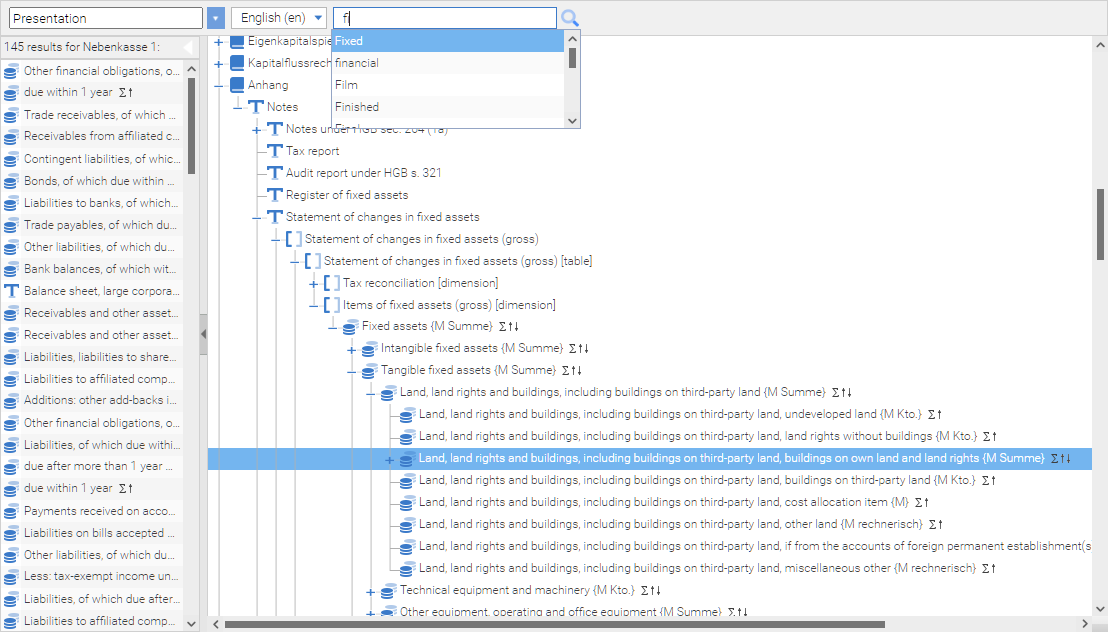
A similar search option provides the search box in the taxonomy view on the left side. When entering a search term the entered terms are completed in a suggestion list. The user is thus informed indirectly about as you type, which terms occur (and can deliver search results) and which are not in the taxonomy positions. After entering one or more keywords the button with the magnifying glass must be pressed and the search result is a list of found taxonomy positions.
Project data view and filter creation
In the “Reports” menu, various reports can be accessed to check the collected data in a project. Moreover, there exists the possibility to define filters for taxonomy positions used in the project. These filters can used either to create individual reports or for filtering the facts for the purpose of filing (function “Send data”).
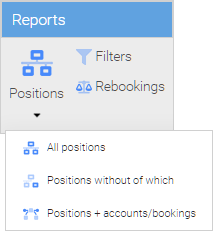
In order to visualize the data collected in a project in a report, there are three types of reports:
-
All positions: representation of the structure of all positions
-
Positions without of which: representation of the arithmetical structure
-
Positions + accounts / bookings: representation of the structure of all positions including the assigned accounts and the impact of rebookings and reclassifications
Rebookigns: list of all rebookings and reclassifications
Report “all positions”
| From version 1.15 there is an additional reporting segment “Outside the reporting structure”. The positions that are not present in the taxonomy, are shown in this segment. |
The report “all positions” visualizes all positions of the taxonomy that contain values. For this, the structure of the so-called “presentation link base” (representation view of a taxonomy) is used. In the diagram view, the positions are displayed, which are not in a arithmetical context to the parent position.
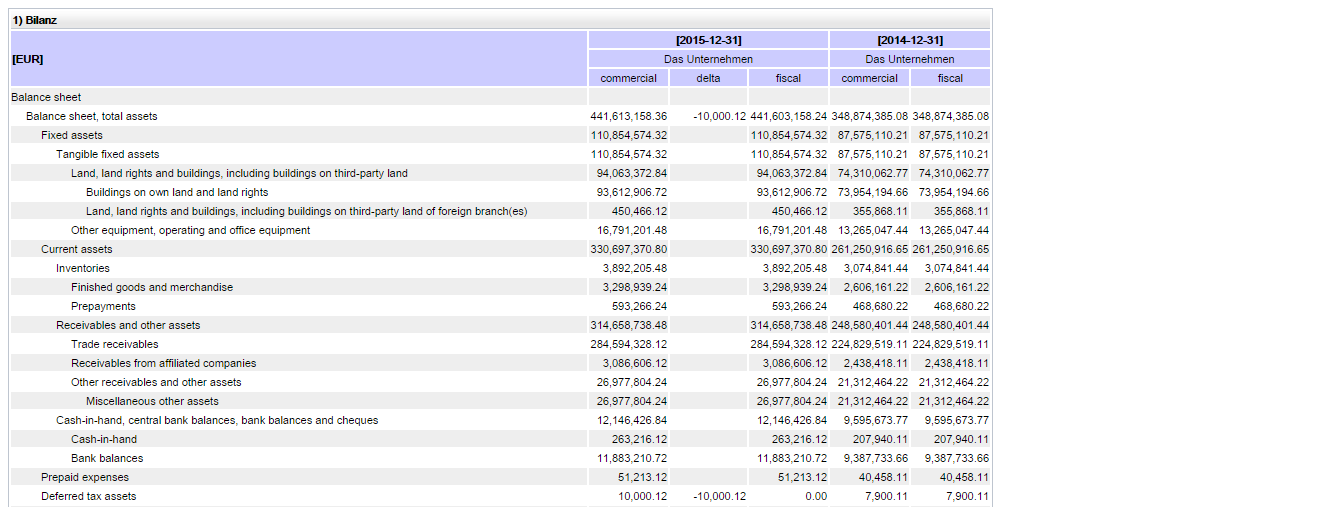
The figure shows a section of the balance sheet. On the left the structure of the balance sheet position is represented by indentations, right position balances are shown in multiple columns (sorted by periods and clients).
Report “Positions without of which”
This report groups the facts according to their arithmetical order, so, Total positions are always displayed in the hierarchy above the positions, whose balances are summarized. Because the of which-positions of an XBRL taxonomy are not linked arithmetically with total positions, the of-which-positions are not shown in this report.
Report “positions + Account Balances / Reclassifications”
In “positions + Account Balances / changes” report the positions are divided as described in the report “all positions”. For each position, the mathematical derivation of the value will be displayed under the position, where the associated balances and the impact of rebookings / reclassifications are displayed.
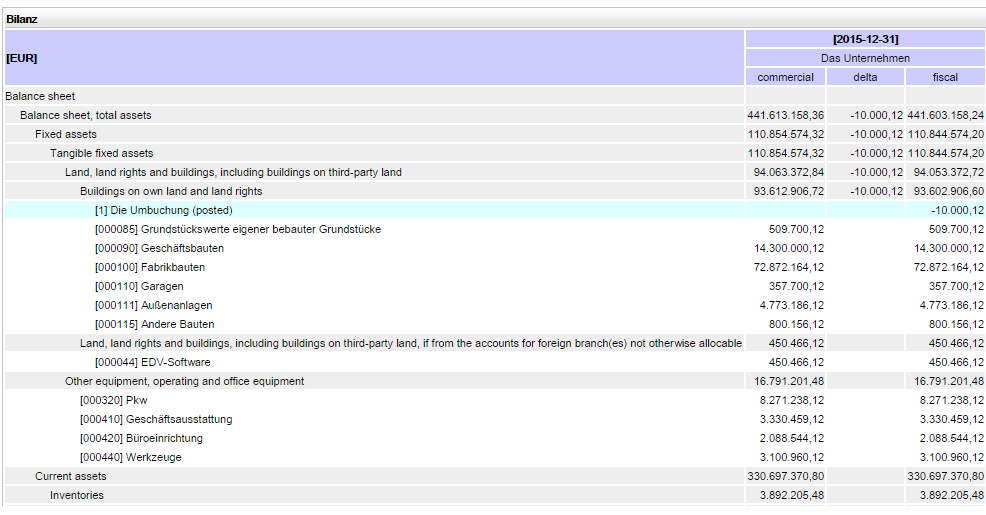
The position balances are displayed in gray shaded rows, balances assigned to a position in white lines. The account number of the associated balance is shown in square brackets.
The impact of the rebookings and reclassifications are shown in turquoise deposited lines.
The balance of a position consists of mathematically allocated balances and the balances of the booking rates of rebookings and reclassifications.
Report generation and settings
By pressing the refresh button in the top left, the report based on the current project data, is performed and displayed. If the report window stays open a long time and changed during this time, (for example by adjustments of accounts allocations, etc.), then the report must be executed repeatedly by pressing the refresh button, so that the current values are displayed
The selection list on the right of the Update button allow filtering of project data. The first selection list has fact collections, forms and account balances, so you can reduce the report presentation on the facts of a particular selection value. Similarly, the report presentation can be limited in the client and period choices to certain clients and periods.
If a taxonomy is multilingual, then the position names can be replaced by selecting a language in the selection list on the right.
Report Printing
Pressing the printer icon button to open the print dialog of the browser.

After confirmation of the print dialog of the current report, it is completely printed.
Download reports as an Excel file
Pressing the Excel toolbar button starts the download of the report as an Excel file.

You can save the Excel file and open it with Excel.
The file is saved in 2007 Format (.xslx, Office Open XML).
How to define filters
With the menu “Reports” → “Filter” can be set for the taxonomies used in the project to select specific positions from the respective taxonomy.
A new filter is created by pressing the “New” button in the upper right. A name must be defined for a filter. Optionally, a description will be given. By pressing the “Apply” button at the bottom right, the filter settings are saved. Through the “Delete all” button, the current filter definition will be deleted.
Inclusion and exclusion of positions through filter rules
The effect of a filter obtained from the filter rules by which a filter is defined. A filter rule in a filter is indicated by an entry in the list box on the bottom right.
In the application of filter rules, the rules for Exclude takes precedence over the rules for Include. If for a certain position a filter rule with the action (= values include) and a filter rule “Exclude” (not include = value) exists, then the values of the position are NOT touched by the filter.
With the “All items” button a filter line is created that includes all positions from a taxonomy.
For Include or Exclude there are four choices:
-
include (individual) position
-
include positions and subpositions
-
Exclude (individual) position
-
Exclude positions and subpositions
To select positions in the taxonomy on the left side, they must be transferred to the lower-right window by drag and drop operations. For the positions acquired in the filter, thereafter an entry for the filter rules effect can be set in column “In- / Exclude”.
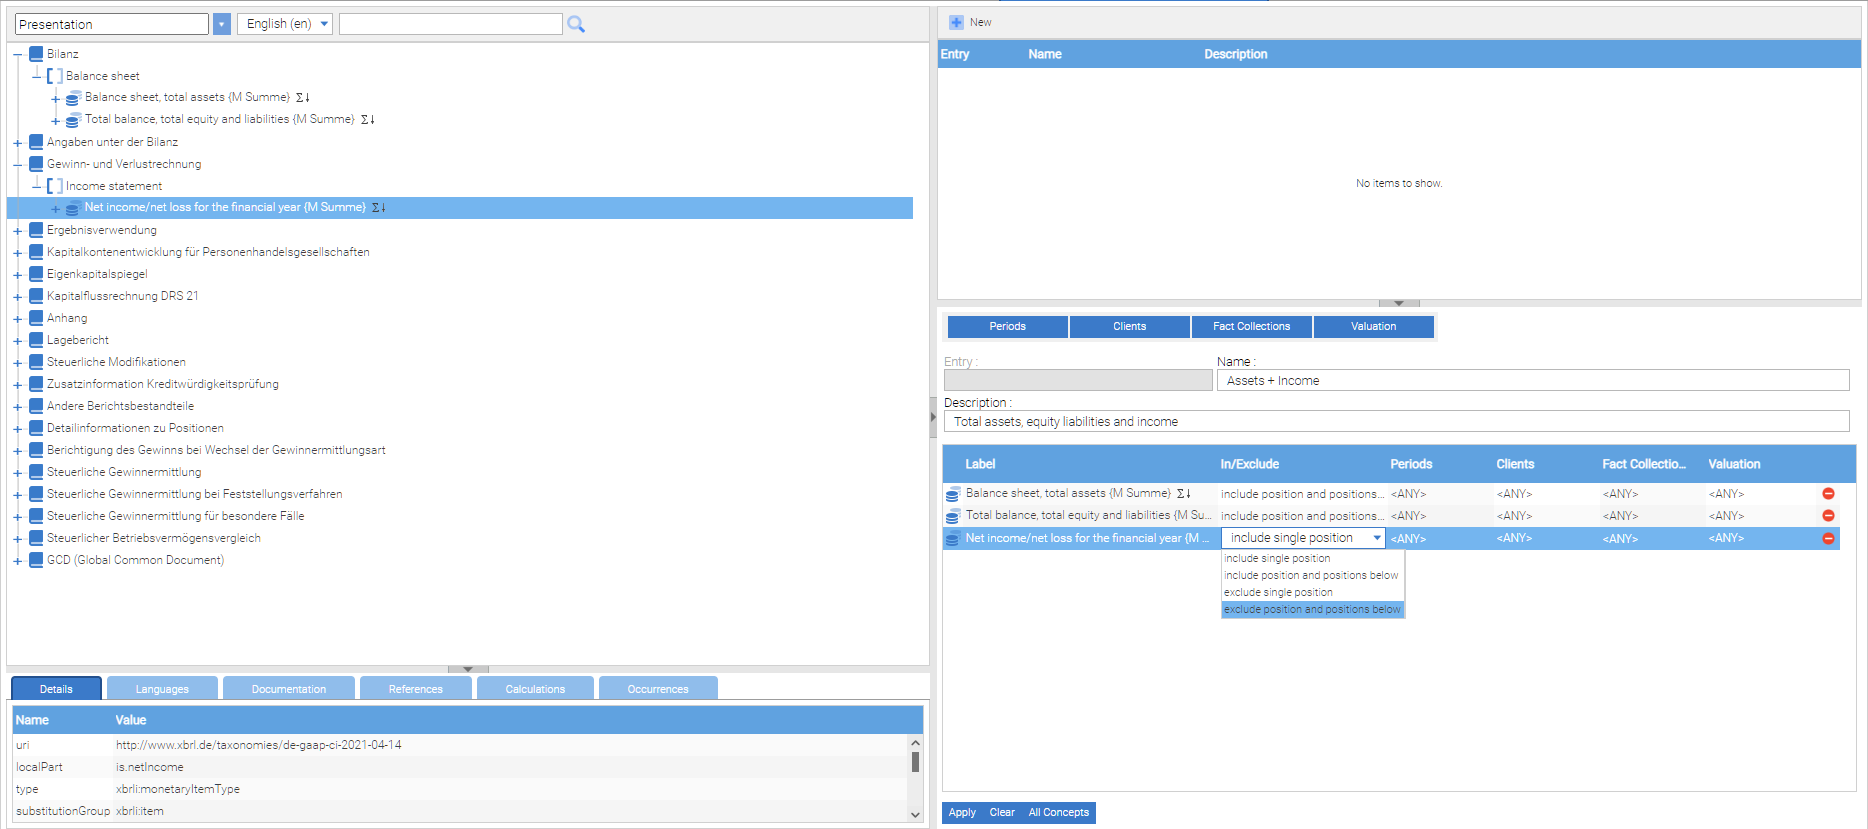
The positions to which a filter rule applies, are in the “Identifier” column. In the column “Periods”, “client” and “fact collections” it can be clarified to the effect of a filter, which facts are affected to the respective positions.
With the buttons in the middle of the right window, default values can be set for the creation of new filtering rules.
image:04/08.png
If the reporting period in 2010 is selected for example as a default value for the periods, then this setting is automatically adopted for all newly created filter rules.
Report “rebookings”
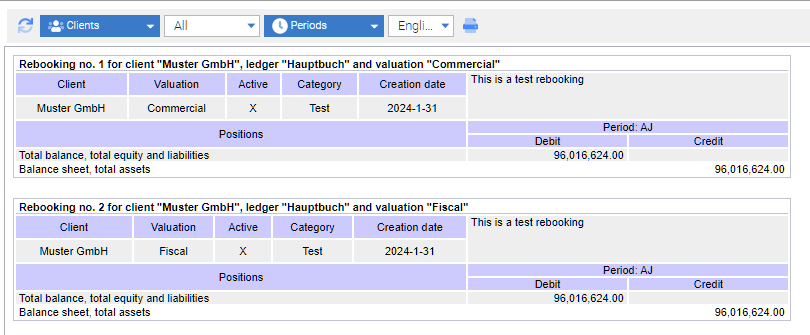
The rebookings report lists all active changes grouped by clients.
For each rebooking the title of the rebooking is displayed along with the balances list and the carrying amount. Further information, like the creation date, and a text description are displayed, too. The rebookings list is grouped by clients, and within a client after the reporting periods (earliest first).
Rebookings creation
How to create rebookings
With imported account balances you can do rebookings - similar to the books (ledgers) of a library.
Changes and rebookings have - as the account assignments - an impact on the calculation of the balances of involved positions,
In order to rebook or reclassify, booking rates are created. When a booking rate contains only accounts it’s called “transfer”. When a posting record contains at least one position it is called a rebooking.
A booking rate consists of debit and credit bookings. These have in total the same amount, so that the booking rate can be unlocked effectivly. This is done by activating the control box “booked”.
Together with the account assignments, the rebookings / reclassifications have an impact on the balances of involved positions. A position balance is calculated as the sum of the assigned account balances plus the sum of the debit and credit postings to the position and the associated accounts.
Through the buttons in the upper toolbar facts can be generated or removed. Pressing this button has the same effect as the corresponding buttons in the tool for creating account assignments.
From Version 1.11. there is the possibility to write a description of the transfer. To do that, click on the “pen” button. After that you can type in the description in the “Description” area, as you can see in the image.
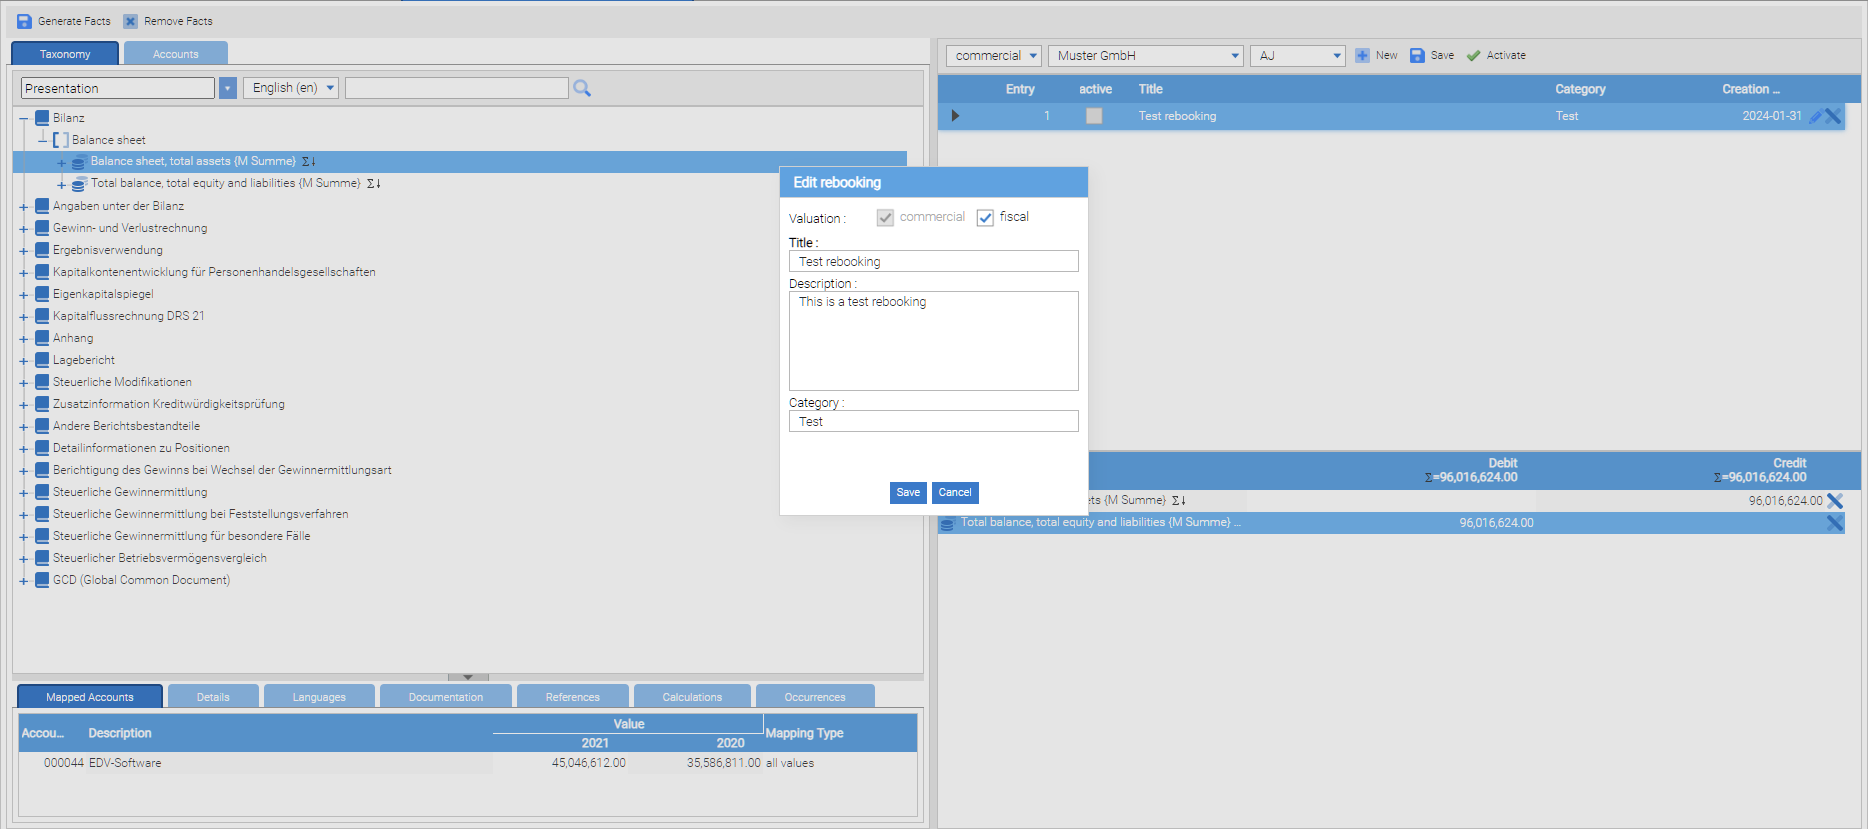
To create a rebooking or reclassification, the toolbar at the top right is used. In the selection list (first line), the period of the rebooking is selected. In the second line of the client is determined and it is set apart whether the rebooking / reclassification is related to commercial law or tax purposes.
According to the settings of these three selection lists the existing rebookings / reclassifications are shown in a list below the toolbar. Existing rebookings / reclassifications can be edit by selecting those in the list. By pressing the “Save” button, the changes are applied and all items removed in the booking rate. With the “New” button (top right), a new booking rate will be created. With the surface “Activate/Deactivate” the rebooking can be activated or disabled.
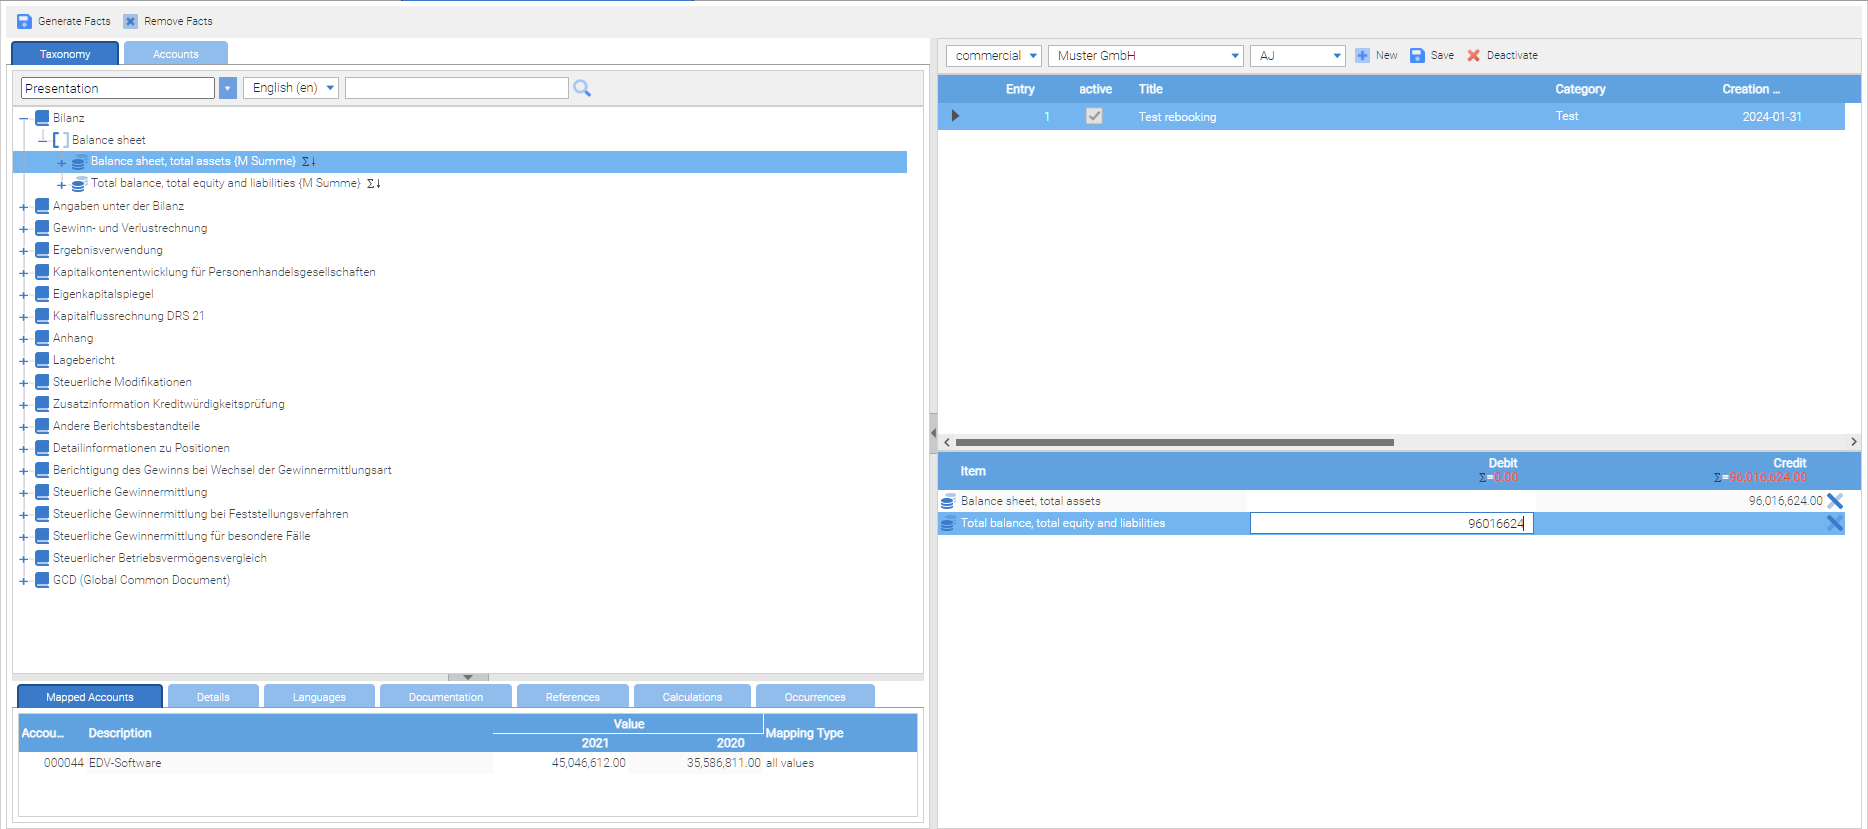
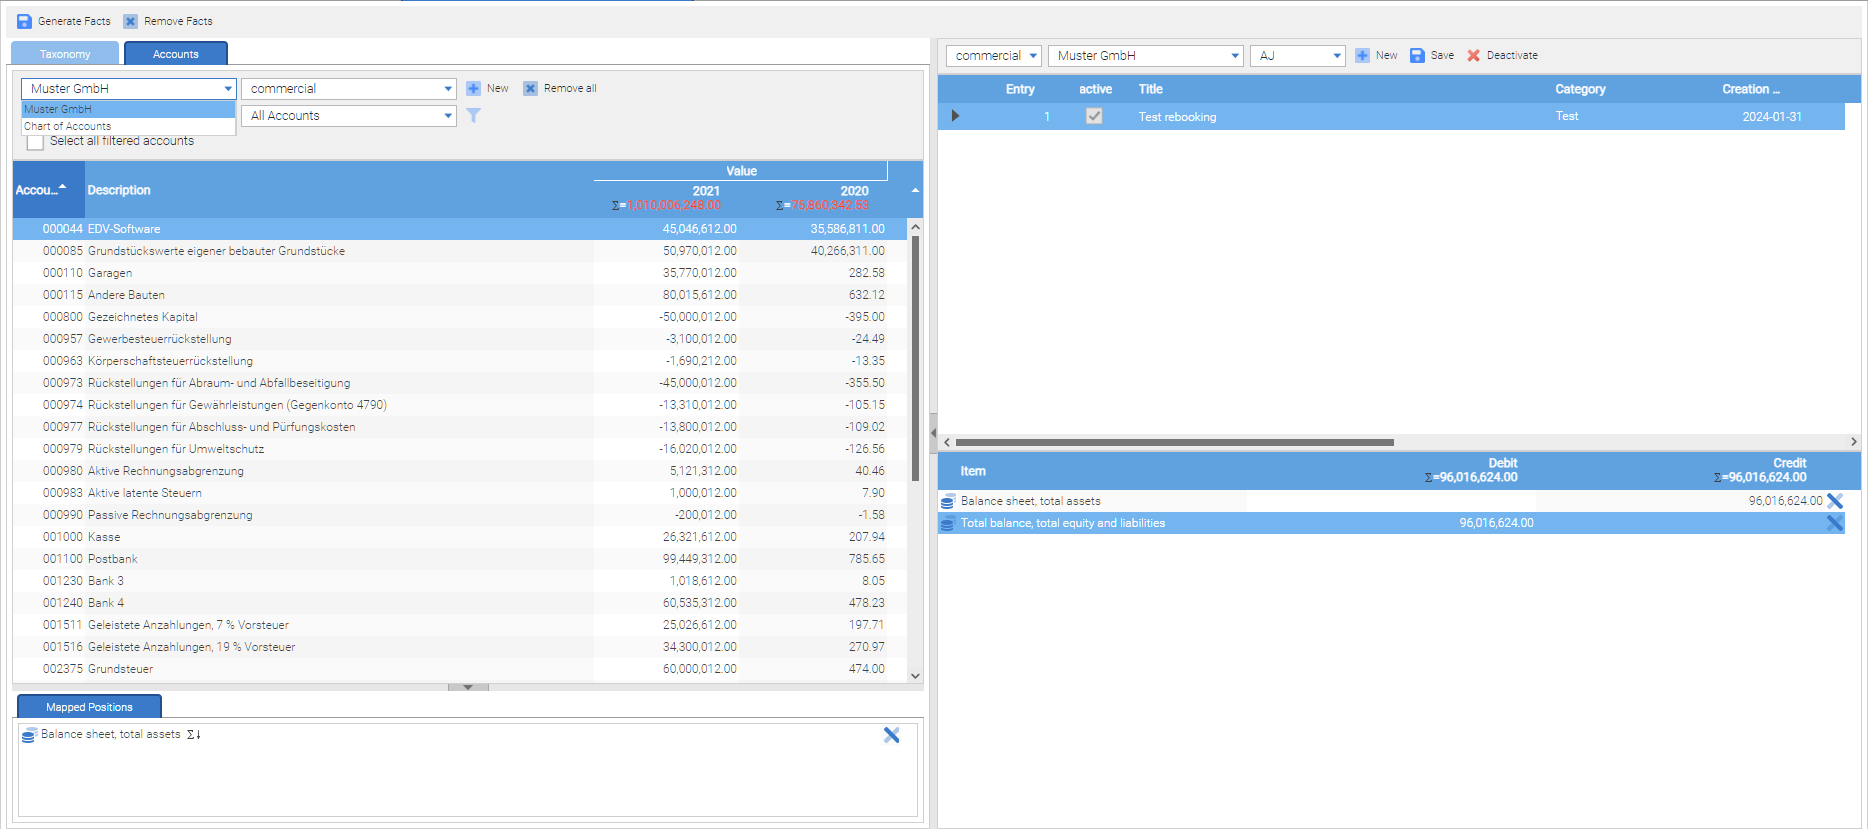
The left pane contains two tabs, the taxonomy and the account balances. Positions or accounts can be easily inserted by drag and drop in the booking rate’s lower right window. After inserting the debit or credit balance of the entry must be adjusted to the desired value. From Version 1.11. even the positions of the chart of accounts can be used in the rebookings – by clicking on “accounts” and choosing the chart of accounts.
| Usualy, it is not desirable to carry out changes and reclassifications outside of the financial accounting system. The functionality of the report Factory can be disabled by appropriate settings in the project configuration for all users. However, there are numerous practical requirements, according to which it may be useful to carry out rebookings and reclassifications outside of the existing accounting systems. An example of this are subsequent adjustments to old balances, caused by audits. With the report Factory it is possible to adjust the balance sheets from previous years, without opening affected periods in the financial accounting systems retrospectively. |
Report project management
Open existing projects

By clicking the dialog “Open” in the project menu, every user can see the projects for which the that user has the permission. The rest of the projects are not shown.
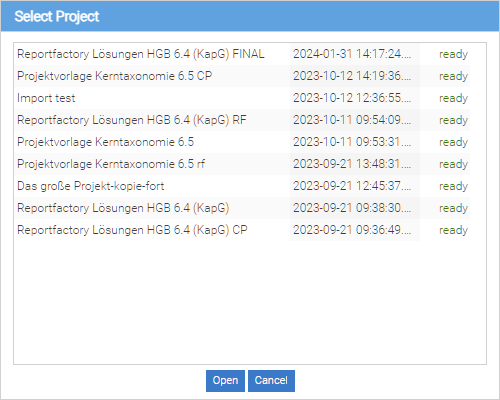
To open a project, the project in the list must be selected and then loaded by clicking the “Open” button.
During the RF installation there is an optional installation step “Creation of sample projects”. If the sample projects were installed, the users can find various preconfigured projects for e-balance taxonomy versions or industry modules in the project selection, that can be adapted to the individual requirements.
Create new projects
Users who have permission to create new projects, can use the “New” entry in the Project menu to create new projects. When creating a project some preparation must be made in the configuration of the project. Therefore, please read the next section to learn about more about the project configuration.
Project configuration
The settings of the project configuration are made in several riders (or tabs) in the project configuration dialog.
By pressing the “Save” button, the settings of all tabs are secured. When “Cancel” any changes to the settings are rejected.
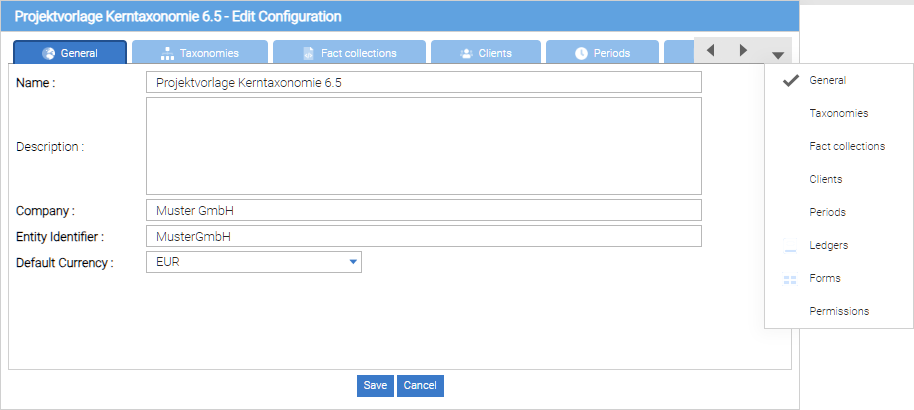
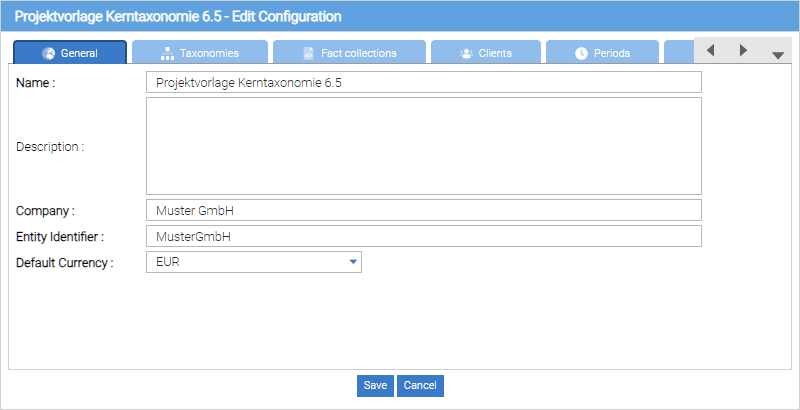
General
In the tab “General” general information has to be filled out. The fields with bold type are mandatory – in conclusion all the fields (exception “description”) must be filled out.
-
Name: Name of the project (will be displayed in the “Open” dialog and in an open project in the title bar of your browser)
-
Description: Description of the content of the report project
-
Company: indication of the reporting entity.From the statement of the reporting entity values are proposed for the following two fields.
-
Scheme URI: specifying an internet address for the company. If the company does not have a web address, the proposed value can be accepted. Recommendation: Just accept the default value.
-
Entity Identifier: Company ID. Technical specification for the production of XBRL filings, which is ignored by most data recipients. Recommendation: Just accept the suggested value.
-
Default currency: default currency for monetary position values in the project
Taxonomies
In the tab “Taxonomies”, one or more XBRL taxonomies (classification scheme) can be selected , to which positions shall be generated in the project.
| Normally in a report project one taxonomy is used, when the project is created for the purpose of creating an XBRL filing for a particular data receiver. |
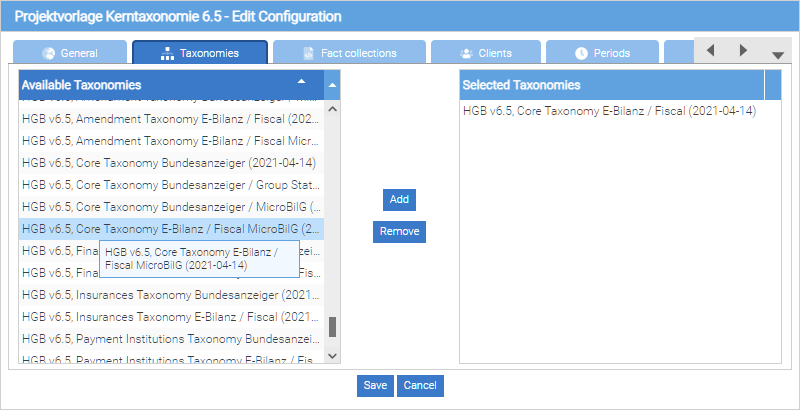
Through the buttons “Add” and “Remove” , available taxonomies can be added for use or selected taxonomies can be removed.
| To save a project, at least one fact collection must be created. |
Fact collections
In the tab fact collections data is summarized. The organization of the fact collection is hierarchical, similar to a directory structure in a file system.
The values of the positions of a XBRL taxonomy are called facts. The term “fact” is used in different reporting tools in the ReportFactory when it comes to the generation of position values. A collection of facts is used for a user-defined subdivision of the generated project facts to the positions of a XBRL taxonomy.
The subdivision of facts can be useful to display only a certain part of the facts in the reports.
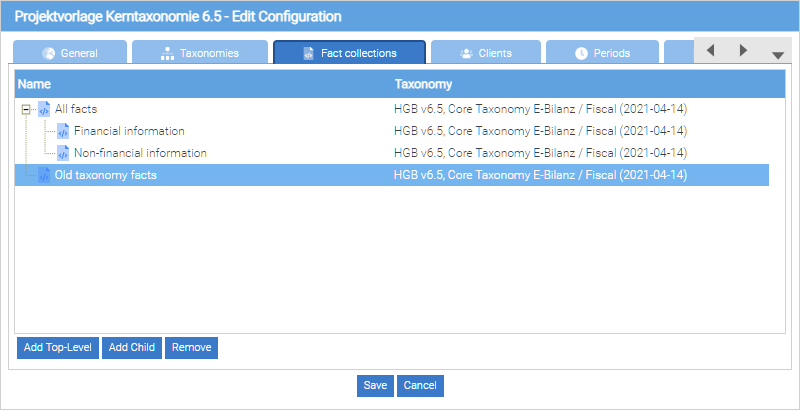
To create a collection of facts, the buttons “Add Top-Level” and “Add Child” can be used. “Add Top-Level” creates a new collection of facts, which is not a subdivision of an existing collection of facts. “Add Child” creates a collection of facts under the currently selected collection of facts. By clicking “Remove” an existing collection of facts can be removed
| Please check before removing a collection of facts, whether account balances or forms were created for this fact collection! If they exist, they must be deleted first, after that the collection of facts can be removed. |
The subdivision of the facts in several collections of facts has no predetermined meaning. It is not a prerequisite for creating a XBRL filing. As a result all the facts can be created in a single collection of facts (without subdivision).
| To save a project, at least one fact collection must be created. |
Clients
In a report project company reports for multiple clients can be created. A XBRL filing is created for each client. Thus, from the perspective of reporting, the term “client” is an essential criterion for the selection of facts to create a XBRL filing.
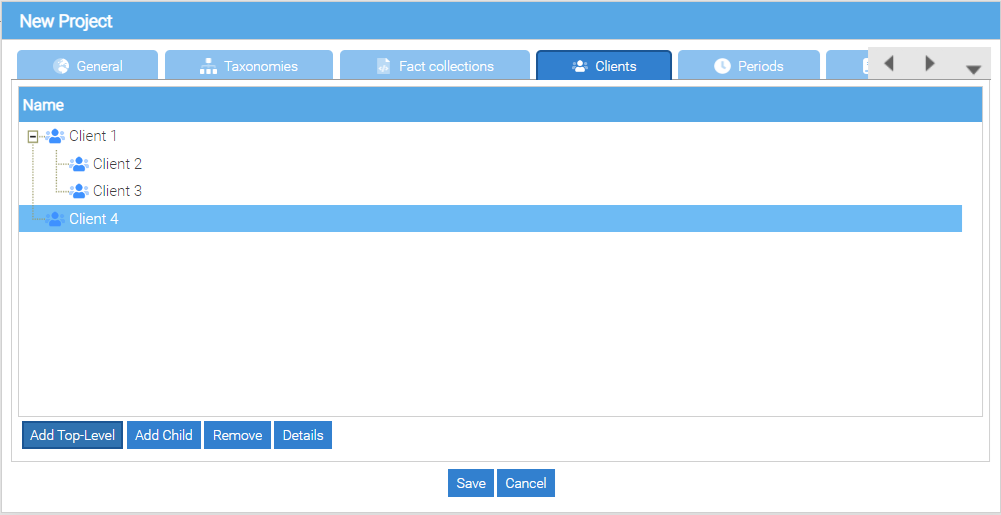
The clients can be sorted hierarchically by pressing “add top-level” or “add child”.
If a client is created under a parent client, then the parent client can be choosen in the project configuration in tab “ledgers” or “forms” to create a balance list or a form exactly for this client and all clients below.
The structuring of clients may for example be used to define a subset of clients in the project account assignments for a standard chart of accounts and to create different mappings for other clients.
| In order to save a project, at least one fact collection must be created. |
Detail configuration for clients
By pressing the „details“ button at a selected client , a dialog opens to set the value transfer to other parts of the report .
The settings in this dialog have an impact on the extrapolation of the facts and depict a functionality that can not be modeled in XBRL taxonomies.
The following logic can be implemented by this functionality . Extrapolating of report part ” income statement ” . Creation of position “net income” in report part “balance `" with the calculated value of "`net income” item from the report part “income statement” . Extrapolating of the report part ” Balance ”
For each client and each fact collection , a different value transfer configuration can be made. This is done by double clicking on a row of the table.
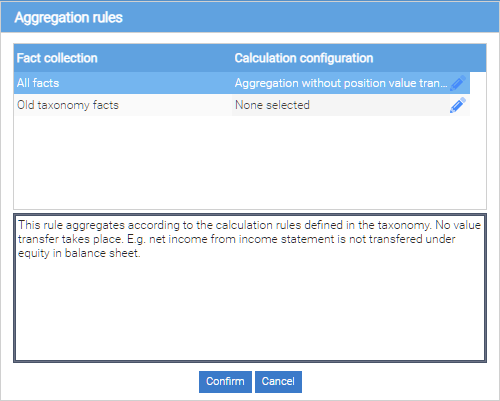
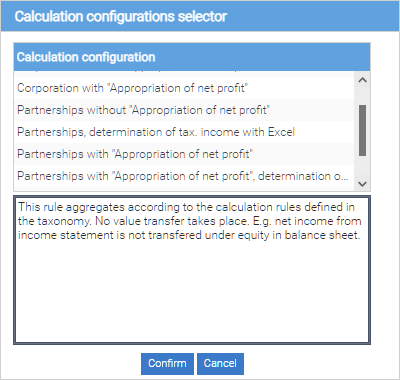
The following dialog shows the available value transfer configurations in the table and a description at the bottom.
By selecting a row in the table and pressing the ” Ok ” button, the configuration is changed .
Periods
Within a project, facts for all report-periods can be defined. In every project exactly one period is leading. This is the current reporting period. When creating periods it is necessary to ensure that the current period is marked as “main” - provided with a hook in the control box.
For a period, the following information can be edit:
Name: The name of a period is used in the column headings of reports and reporting tools. When determining a name it should be ensured that the name is formulated neutrally, if the project settings shall be used in the next reporting periods for derived projects.
Description: Free text description of a reporting period
Duration: Possible values: annual, biennial, quarterly or user-defined. By choosing user-defined the beginning and end of the period can be set freely. Otherwise, the start date and the end date is always adjusted when changing the end date or start date.
Beginning of the period: beginning of the reporting period
End of the period: the end of the reporting period
Main: Defining the leading period. This selection is only possible for a period in the project.
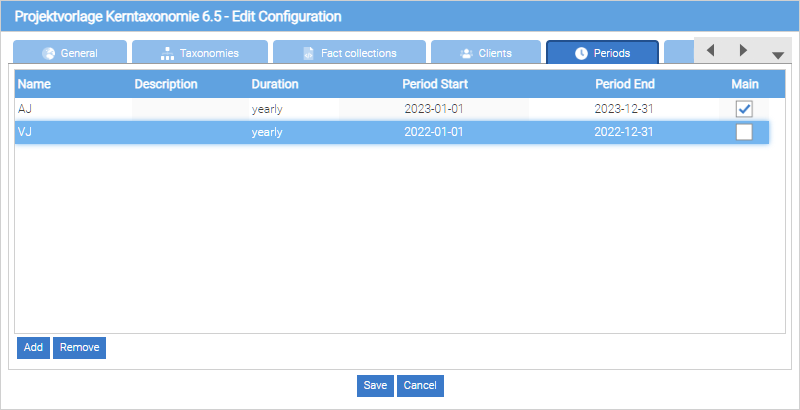
If the recipient of an XBRL filing allows only facts for certain periods, the available project periods should be configured restricted. If inadmissible periods are available for the submission, for creating a XBRL filing a filter must be set, which filters only the allowed period values (Example: For an e-balance submission only the transmission of the current marketing year and the previous year is allowed). If facts for more prior periods or year periods are avaialbe, they must be removed by a filter in the submission.
| In order to save a project, at least one leading period must be configured in the project |
Ledgers
To import financial information from an existing accounting software into the Report Factory, one or more account balances must be configured in a project. It is immaterial whether a ledger at a later import is filled with account balances or balances positions. It can also be defined in subsequent import operations, whether it is commercial law balances (for example, from a financial accounting software) or tax balances (for example from a tax software).
For each balance list you can import data from an operational system separatelly (independently of the other account balances). The definition of multiple account balances, for example, enables the import of data from sub-ledgers or managing account assignments for different charts of accounts.
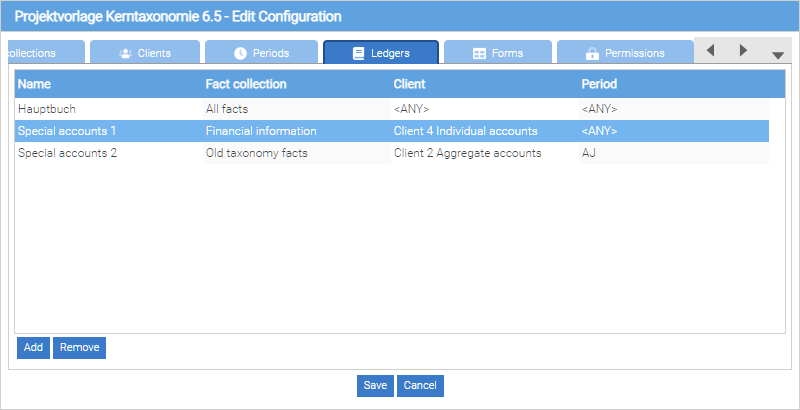
When creating a balance list the following information must be provided.
Name: Name of Balance
Fact Collection: Allocation of balances list to a specific collection of facts (and thus also to a taxonomy!)
Client: Assignment of balances list to a client (and all its clients in the hierarchy of the client configuration). By selecting the value “<any>”, a fact collection for all clients in the project is available.
Periods: Allocation of balances list to exactly one period or all periods ( “<any>”). By selecting one or any periods, the balances import is approved for one or all periods in the project.
Connected form: If the control box is provided with a hook, the calculated commercial facts of the account balances are accepted automatically as tax facts into a homonymous form. This functionality often leads to confusion. We no longer recommend using.
| The selection of facts collection, clients and periods limits the area, for which account balance is allowed to be imported. |
| The aggregated position values of the taxonomy positions can not be changed subsequently (= read only), unless an updated list of account balances is imported. |
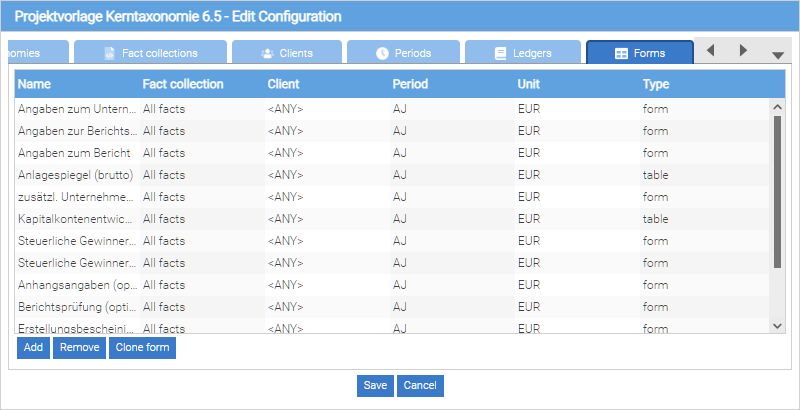
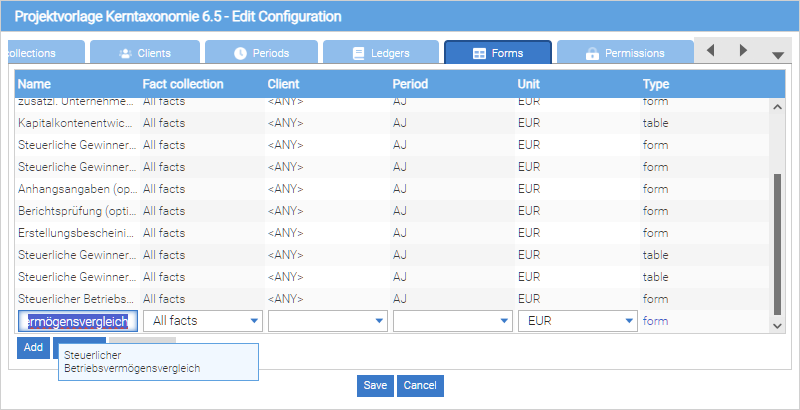
Forms
The forms in the ReportFactory are used for manual determination of facts for all types of report positions. In conclusion that includes not only positions with financial information, but also text positions, dates, selection values positions, etc. and positions which include data structures (for example, address information), that are composed of several individual positions.
With table forms multi dimensional reporting is possible. For this, table forms can be created with dimensional position hierarchies in rows and columns.
In the project configuration, the forms are “pre-configured”. The content of the forms, so the selection of taxonomy positions, can be determined at a later date by a tool to “create / modify” the forms.
-
Name: Name of the form
-
Fact Collection: assignment of the form to a specific fact collection (and thus also to a taxonomy!)
-
Client: containment of the form for data entry to a particular client (and all its clients in the hierarchy of the client configuration). By selecting the value “<any>”, a fact collection for all clients in the project is available.
-
Periods: Assignment of the form to exactly one period or all periods (”<any>”). At the later selection of the taxonomy positions for a form, the data collection may be limited to a portion of the allocated periods.
-
Unit: default currency unit
-
Type:
-
Form: Usage for one-dimensional parts of the report (for example, income statement)
-
Table: Usage for table spaces with multiple reporting dimensions
-
| Similar to the selection of the fact collection, clients and periods, also the value range for forms can be limited. In addition, a default value for the unit of currency can be specified, so that in this currency values for monetary items are recorded in a form. |
| All the facts collected in a form can be changed at a later date (= write). |
Clone form from other projects
By pressing the button “clone form” it opens a dialog for accepting forms from other projects. Only forms that match the used taxonomy of the current project, are displayed in the list. In addition, only forms of projects in which the user is “Project Administrator” are offered .
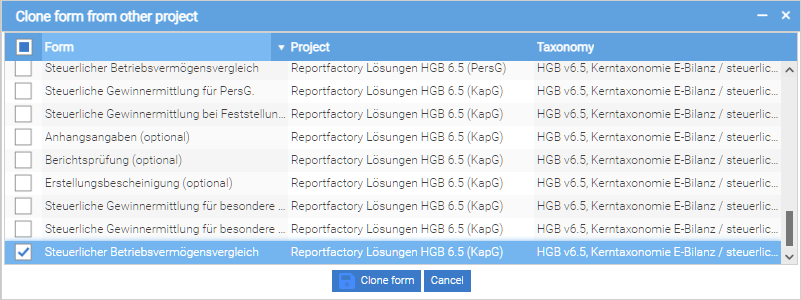
By selecting a form and then pressing the button “Clone form” the selected form is copied to the current project with all input fields.
Subsequently, the user can still change the name of the copied form and restrict the value range.
Permissions
| This tab and its contents are only visible to the Project administrators |
The access rights within a project report are managed relating to specific reporting functions:
-
Admin: The user has permissions to all functions in a project
-
CSV import: running the function in the “Ledgers” menu → “Import chart of accounts” or “Import balance list”
-
Account assignment: running the function in the “Ledgers” menu → “Account mappings”
-
Rebooking: running the function in the “Ledgers” menu → “Rebooking”
-
Edit forms: running the function in the “forms” menu → “Modify”
-
Enter data in forms: running the function in the “forms” menu - “Enter data”>
-
View reports: running the function in the “Reports” → menu “Filter”
-
Edit Filter: running the function in the “Reports” → “Filter”
-
Send data: running the function in the menu “Project” - “Send data”→
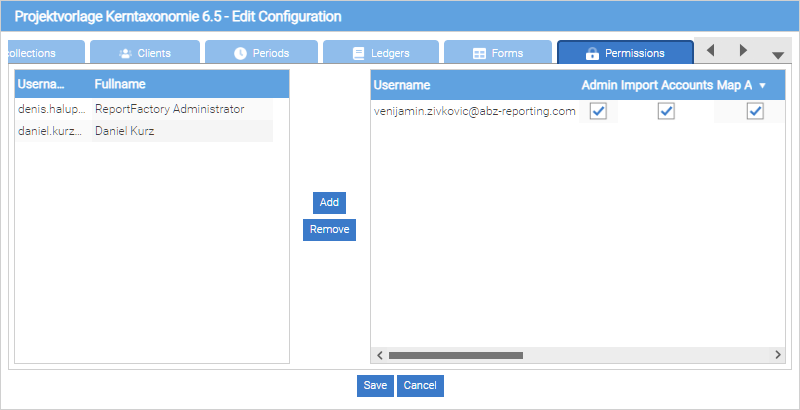
To give a user access rights, a project administrator has to add the user to the configuration list from left to right (by clicking “add”).
Subsequently, the project administrator can assign users individual permissions when the respective control boxes are activated.
The creator of a project is always automatically Project Administrator. The creator may establish other project administrators, if the control box “Admin” is activated for these users.
| A project administrator can’t evade any rights within a project. |
To revoke a project administrator rights, another project administrator of this project must remove the hook “admin”, and then save the project configuration.
Delete a Project
To delete a project it must be opened.
Project à Delete. By choosing this entry, the project will be deleted.
Changing the project configuration
To subsequently change a project configuration , the dialog for the project configuration in the “Project” menu can be set with the entry “Configure”.
How to sent project data to a receiver
Data created in a ReportFactory project can be sent directly to a data receiver.
The conditions for sending the data to a receiver are that the recipient has a submission interface for XBRL data and that an appropriate filing Addin is installed for the ReportFactory. With the ReportFactory E-Bilanz Addin the transmission to the german financial department is supported.
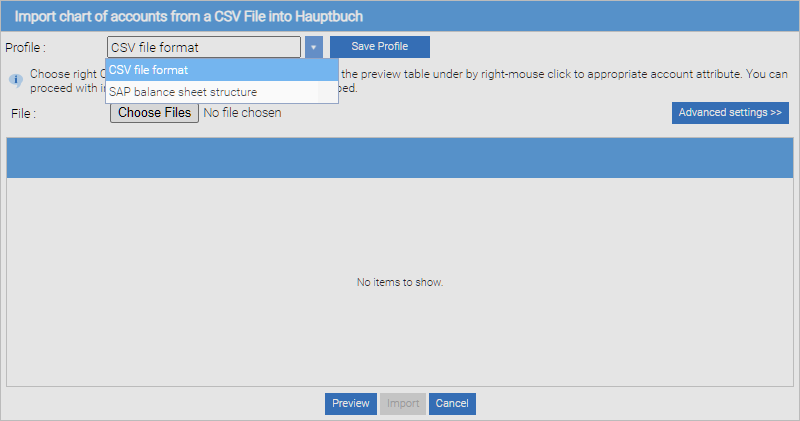
Import a chart of accounts
For each account balance list, which was created in the project configuration, a chart of accounts or balance (next section) can be imported.
The chart of accounts Import allows you to import a description of a chart of accounts from an operational system. After the import of a chart of accounts, the accounts can be easily assigned to taxonomy positions in the order of the chart (Mappings). This assignment is necessary to calculate the balances of reporting positions through balances of the previous systems.
The import of a chart of accounts is not mandatory if the account information is existing in the balances files of the previous system. However, the balance list files from legacy systems usually contain only the accounts that were actually posted for a client. Therefore it is important to use the same chart of accounts in a reporting period with multiple clients, to get a uniform account assignment for all clients.
As an import standard, CSV and SAP balances files are supported.
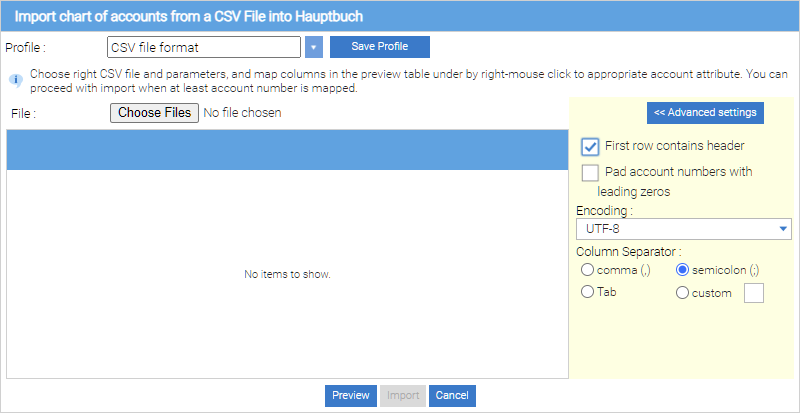
CSV Import
By selecting the profile “CSV Format”, a chart of account which is in a CSV format can be loaded into the Report Factory.
Advanced settings
The CSV file, which shall be imported, is selected by pressing the “Choosing file” button. After that, multiple settings vor the CSV import can be made, for that click on the “advanced settings” button.
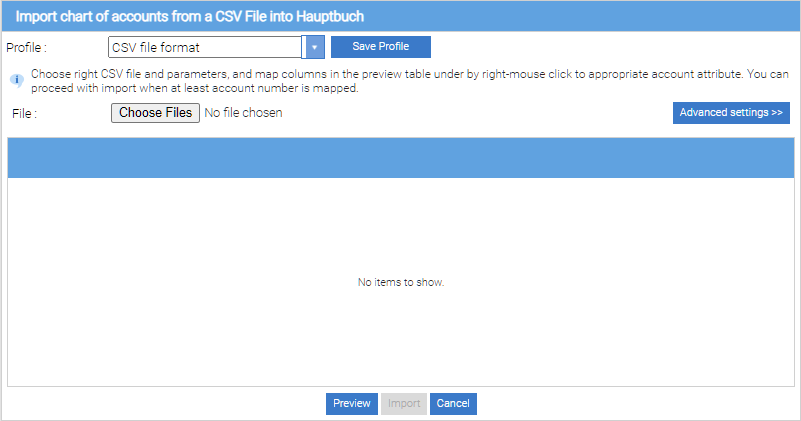
These settings depend on the source system used and can be different thus depending on the feeder system.
-
First row contains column header: specifies whether the first row of the CSV file contains column information. The data of this line are ignored during import.
-
Column separator: separator for the individual properties of an account
-
Encoding: character set of the import file
-
complete account number with leading zeros: If account numbers exist with a different length, the accounts with a smaller number of digits than the maximum number of digits are left supplemented with zeros, so that after the import all account numbers have the same length.
With the “preview” button, the import file is loaded and displayed. Since the order of the columns is not standardized in CSV files, the columns may contain following characteristics:
-
Account number
-
Description
-
Position key (credit or debit key)
-
Five user-defined information
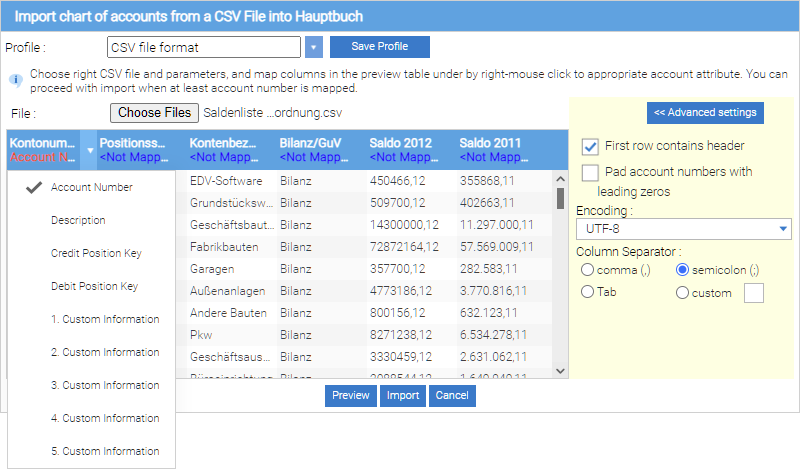
For the data import, at least one column must have the information „account number“. Based on the account number the assignments of the account balances to reporting positions are done later on. Therefore, the account number must be a clear criterion in the import file - there may be only one line for an account number.
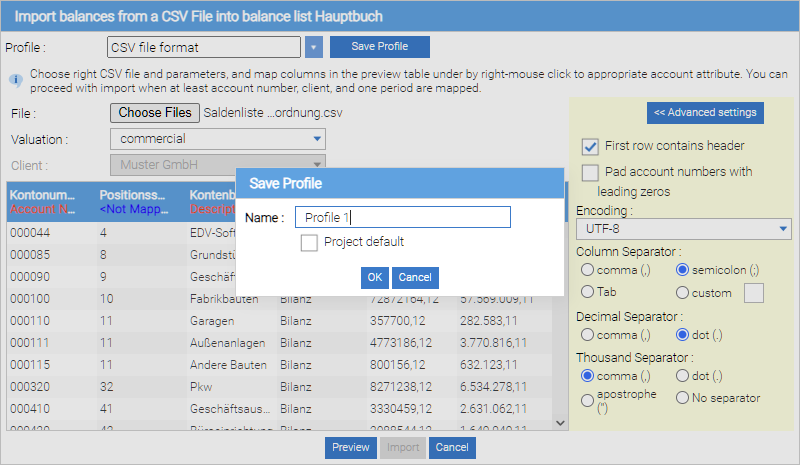
Saving an user-defined import profile
From Version 1.11 it is possible to save the import settings as a custom profile. To save a custom profile, you first customize advanced settings and arrange the columns after the preview. Then click on the “Save Profile” button. In the next dialog, enter the name of the custom profile.
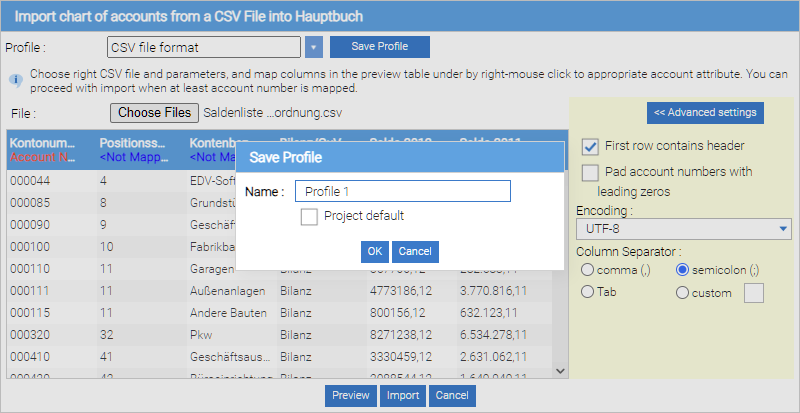
By pressing the button “OK” the import profile is stored. If you want to set it as a default for the current project, place a hook in the “Project default” checkbox.

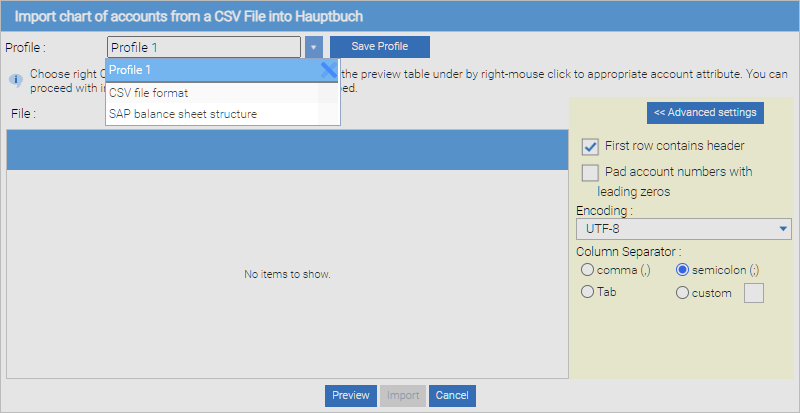
By defining a project standard, the appropriate profile is selected when you open the Import dialog.

To delete a custom profile, first click on the Profile in the selection list. Then click the delete icon to delete the profile.
SAP balance file import
By selecting the profile “SAP balance sheet structure”, a chart of account, which was exported from SAP, can be loaded into the report Factory.

The SAP balance sheet structure file with the specific chart of account information is selected by pressing the “Choose file” button.
With the “preview” button, an import file can be loaded and displayed.
By pressing the “Import” button, the accounting system information is imported to the ReportFactory.
How to export SAP chart of accounts
The special structure that supports the ReportFactory chart of account important, is a special export of SAP balance sheet structure.
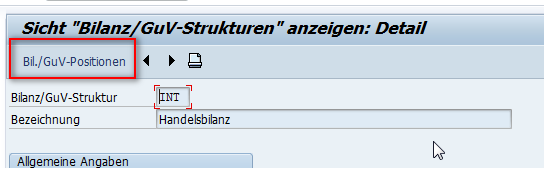
You can execute the export in SAP in the window “SAP Bilanz/GuV-Struktur ändern” (Transaktion FSE3 or FSO2)
At this screen, you get the navigation bar on the following items.
For classic General Ledger Accounting (in Customizing Guide):
Finance - General Ledger - Business Transactions - Conclusion - Documenting - balance sheet / P & L structures define.
For the new General Ledger Accounting (in Customizing Guide):
Financial Accounting (New) - Define balance sheet / P & L structures - General Ledger Accounting (New) - Master Data - ledger accounts.
After selecting the desired structure in the Bil./GuV-Positionen jump.
Next, you can expand the entire balance sheet structure tree by clicking
on the icon 
Make sure , that in the display options the vlaue “Mit Konten-/Funktbereichs-Texten” is selected.
Then you can export the list with the menu item
System - List - Export - Local file.
Choose Liste sichern in Datei and the file type “unkonvertiert”.
-
Choose

-
In Liste auf lokale Datei übertragen type the path and the name of the file, in which you want to write data
-
Choose Übertragen.
Import account balances
During the import of a chart of accounts, only one “abstract” description of the chart of accounts is accepted. During the import of account balances, balance lists with specific account balances from an operational system are accepted, so that with that data account balances of balance positions can be calculated.
Similar to the chart of account import, that functionality supports the CSV data type.
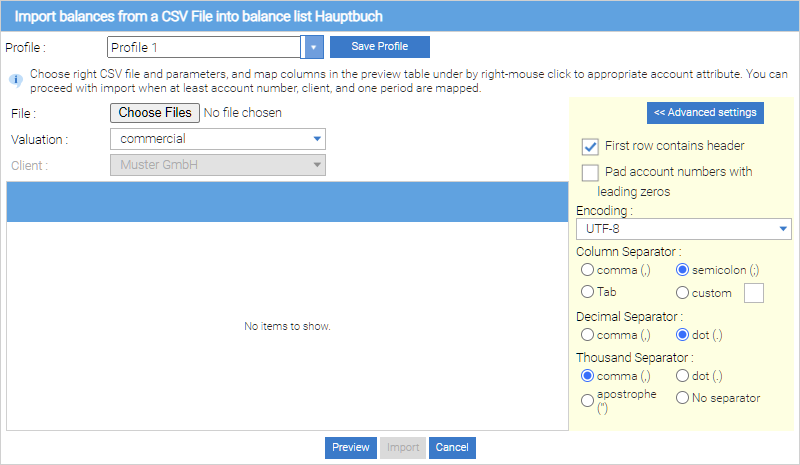
Advanced configuration
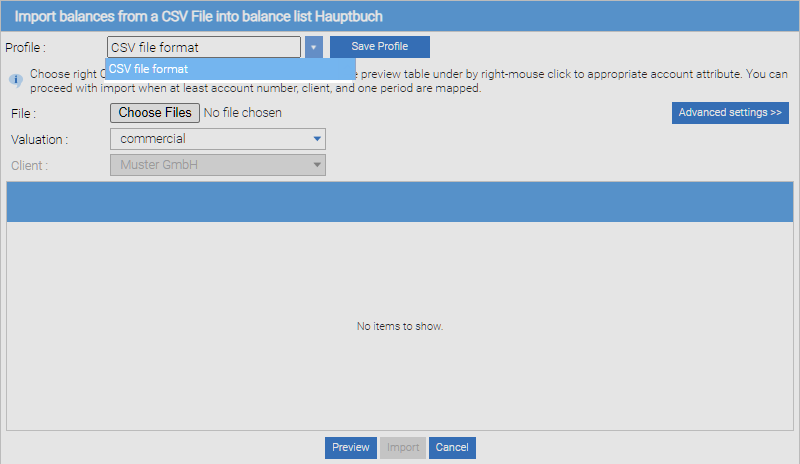
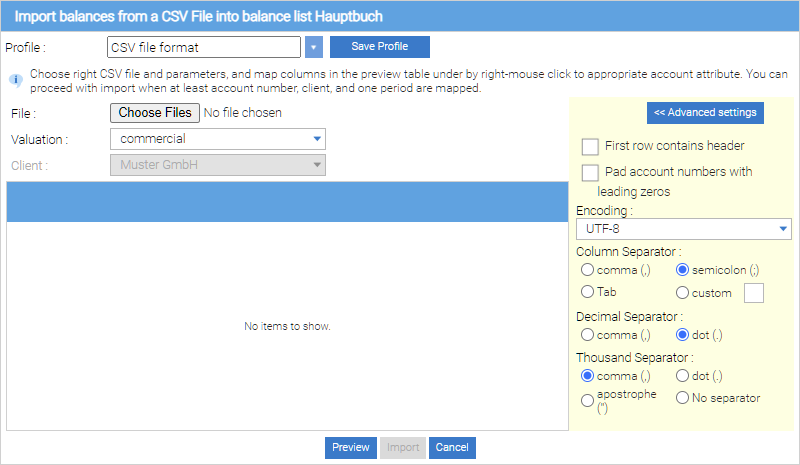
The CSV file, which shall be imported, is selected by pressing the button “choose files”. Subsequently a number of advanced settings for the CSV format can be made. To make advanced settings visible, press the “Advanced Settings” button.

The settings may be different, depending on the source system used.
-
First row contains column header: specifies whether the first row of the CSV file contains column information. The data of this line are ignored during import.
-
Column separator: separator for the individual properties of an account
-
Decimal separator: separator for the decimal places of numeric values
-
Thousands separator: separator for the thousands digits (analog million etc.) of numerical values
-
Encoding: character set of the import file
-
Complete account number with leading zeros: If account numbers exist with a different length, the accounts with a smaller number of digits than the maximum number of digits are left supplemented with zeros, so that after the import all account numbers have the same length.
With the details of the fields “Valuation” and “Client” it is set during data import, for which clients shall data be imported and whether it is commercial, legal or tax balances.
With the “Preview” button, the file to be imported are loaded and displayed. After displaying the preview of each column of the import file the following properties can be assigned:
-
Account number
-
Description
-
Periods
-
Position key (credit or debit key)
-
Client (optional)
-
Five custom information for the account (for example, account group keys, debit / property, profit and loss account etc.)
If a balance list shall be imported for one client only, then this client in the selection list “client” can be selected. If the balances Import shall be executed for multiple (any) clients, then a column of the CSV file can containing the client key. The client key must match with the client identifiers of the project configuration, so that balances of the clients can be assigned correctly.
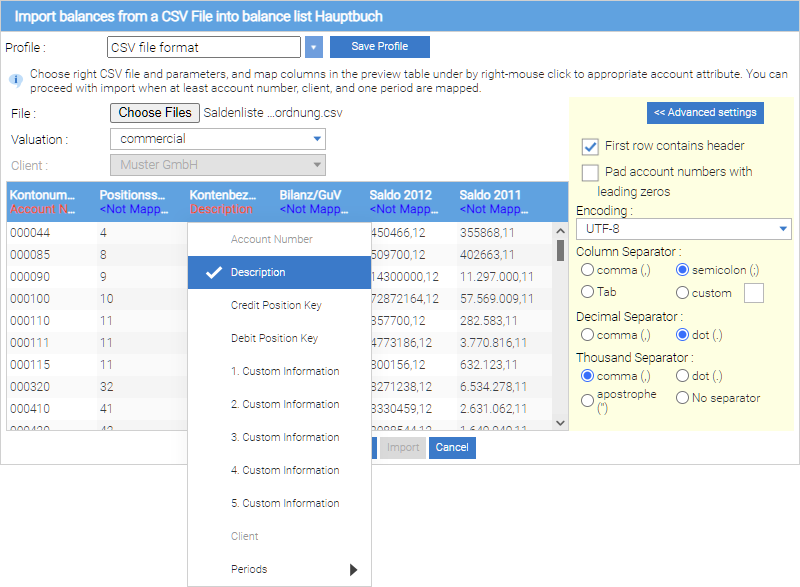
Depending on whether one or more periods have been configured in the project, one or more columns of the import file can be assigned to these periods.
For the data import at least the properties of “account number”, “client” and one period of each column must be assigned. The account number must be a clear criterion in the import file - there may be only one line for an account number.
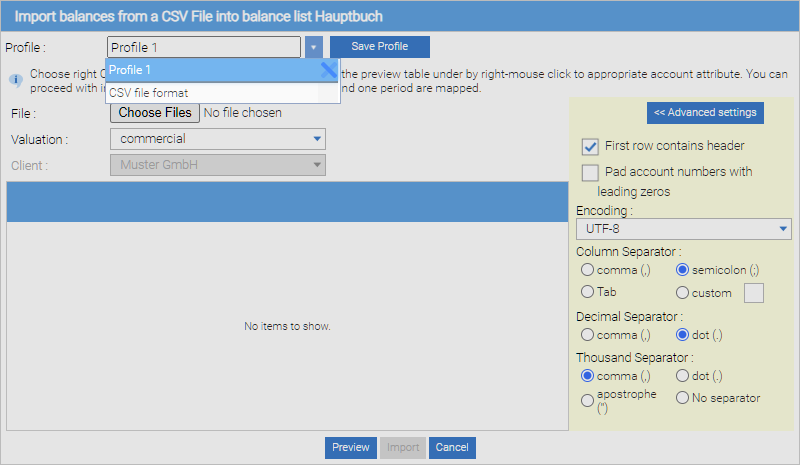
Saving an import profile
From Version 1.11 it is possible to save the import settings as a custom profile. To save a custom profile, you first customize advanced settings and arrange the columns after the preview. Then click on the “Save Profile” button. In the next dialog, enter the name of the custom profile.
By pressing the “OK” button, the import profile is stored. If you want to set it as a default for the current project, place a hook in the “Project default” checkbox.

By defining this as a project standard, the appropriate profile is selected when you open the account balances import.
To delete a custom profile, first click on the Profile selection list. Then click the delete icon to delete the profile.
Sending e-balance reports
From the data collected in the project, reports can be created and sent relating to the clients which are available in the project. The functionality of this can be executed via the menu item “Send Data” → “e-balance” in the “Project” menu.
The tool for sending electronic reports in XBRL format includes a toolbar, here the filter for filtering the data and the client to transmit a report, can be selected.
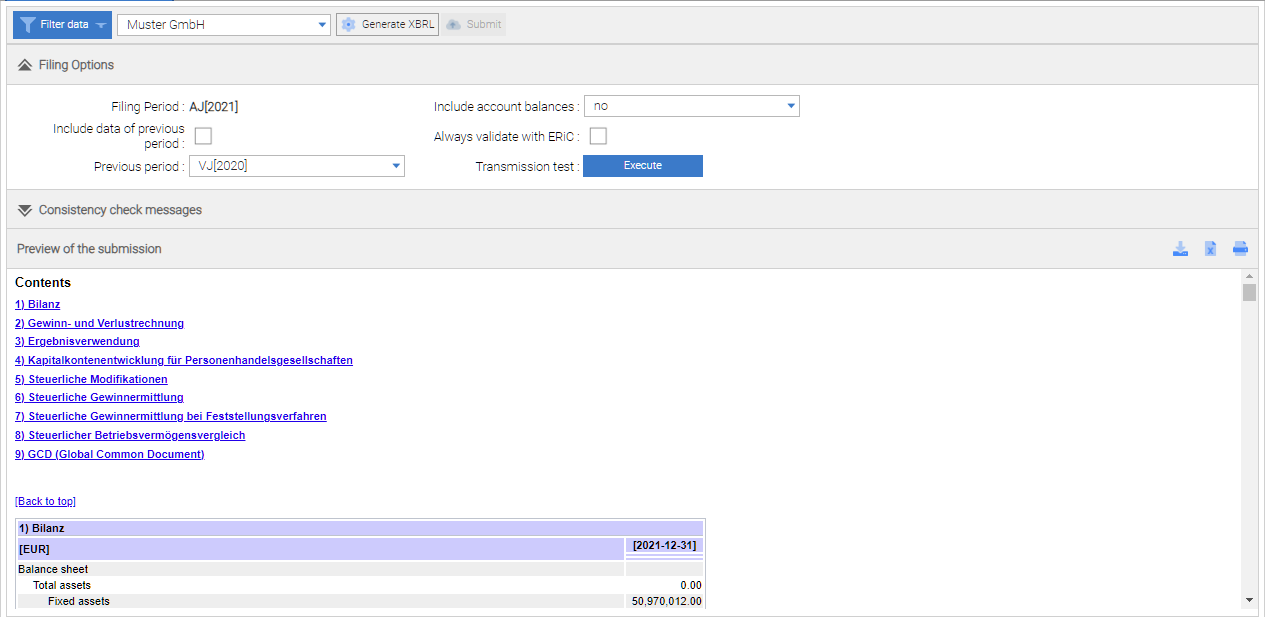
Submission options
“Generate XBRL” By pressing the button, a submission record is generated. Prior to the generation of the record, in the submission options changes should be made, which may influence the type of generation of the filing record and the transmission.
For e-filing balance the following filing options exist:
-
Filing Period: Means the period leading the project. This can not be changed.
-
Include Data of previous period: The checkbox indicates whether the data of the previous period should be transmitted in addition to the leading period. This is done by activating the checkbox.
-
Previous period: If a previous period should be included in the transmission, a period that has been configured in the project, can be selected from the list as the previous period. It is also necessary when filing a trade balance with reconciliation reporting, to specify a previous period.
-
include account balances? By selecting one of the following values , it can be decided whether and which account balances are received
-
No: There are no account balances submitted
-
Yes, but only required field, accounts detection desired: Only the account balances are transmitted , which are assigned to a taxonomy position “Required field, accounts detection desired”
-
Yes, all: All account balances submitted
-
Always validate with ERiC: This option forces the check of the submission with the ERiC component of the financial department.
-
Hints for executing e-balance plausibility rules
For filing and sending an e-balance , the data set must satisfy the Plausibilty rules of the financial department. Therefore the ERiC component of the financial department was integrated in the ReportFactory. With this, the record can be checked prior to the filing and transmitted thereafter. Records that cause testing errors, may not be filed!
The check rules of the ERiC component were implemented independently in the report Factory, to execute the plausibility rules in meaningful compiled test blocks and to provide meaningful error messages. There can be no assurance that the test result of the report Factory with the ERiC component matches 100%, because the check routines of ERiC component were not disclosed. For this reason, the plausibility of ERiC component is always executed after performing ReportFactory- plausibility. It is possible to submit each record, having passed the ERiC-plausibility, even if the test is failed by the report Factory Plausibilisierungsregeln.
Preview and check of submission
When creating the XBRL data set for submitting the validity of the data set is checked. The test results are displayed in list form in the middle window “Check Filing”.
If a check rule generates a test result, this result is displayed in the list of check reports. A test message contains the following information:
-
Check step: Identification of the check step in which the error occurred. check steps summarize a lot of tests, to group the test results meaningfully.
-
Error type: Type of test message, for example, Warning or error
-
Test Message: Description of the test results, for example with a description of steps to remove erros
If a was created, all the submission data is shown in the preview window below. This gives the transmitter the opportunity to check the complete filing record, finally.
Transmission test
To test the transmission, use “Execute”. Does the submission indicates no errors the current data set is transmitted. If there are errors in the submission set, a submission with synthetic data is used to test the transmission.
| A test transmission does not count as a valid deadline submission. |
After pressing the “submit” button, the transmission of the data set is started. If the transmission could be carried out successfully, a completion message appears. After that, it is possible to download the delivery protocol by pressing the “Protocol” Button.
Binding data transmission
If a filing record was generated also the “XBRL Download” button in the toolbar is activated. Pressing this button, the full set of data, which is ready for submission can be be stored in a file. The storage function can be used to archive the data set or for technical error analysis.
When the filing could be generated without plausibility errors, then also the “Submit” button is activated. After pressing this button a submission dialog will appear, here the mandatory transfer to a data receiver can be performed.
When transmitting e-balances the indication of an electronic certificate is required. The submission dialog for e-filing balance is shown in the following figure.
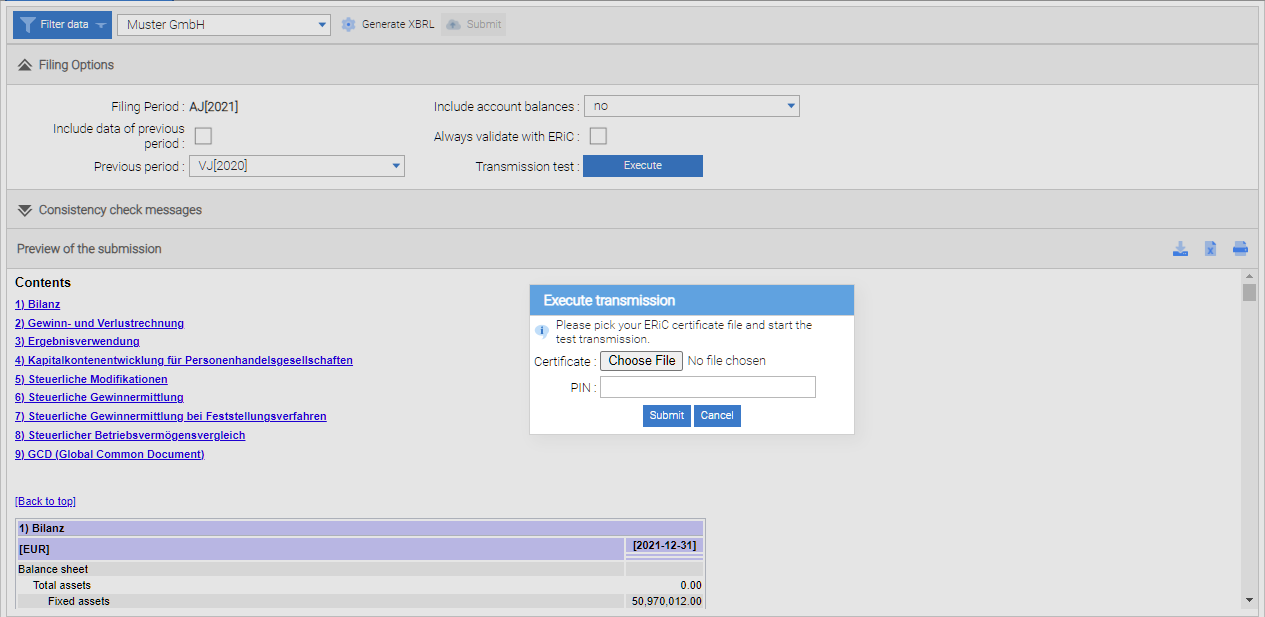
Archiving the submission
With a successful submission this is archived by the report Factory Server in the subdirectory “filingArchive” of the application data.
| In a single-user version with default directories it is the folder “C: \ Program Data \ ABZ Reporting \ Report Factory \ filingArchive”. |
An archive contains all relevant data submission, and data that is expected in archiving systems. Specifically, these are: (accounts, account assignments, transfers, reclassifications, forms, etc.) of the client, as well as the data. In addition, in the archive file, the following information is stored:
-
Submission ID: a string that uniquely identifies a submission within the report Factory
-
Filing Date: The date and time of submission
-
Submitter: Report Factory user, who pressed the”Submit” button
-
Filing Options: set file options
-
Data of mandates: the output data of the client to create the submission record (client, accounts, account assignments, transfers, reclassifications, forms, form values, etc.)
-
Filing record: to the tax authorities transmitted XBRL data.
-
Checksum of filing record: checksum to verify the integrity of the filing record
-
Preview: Preview Displaying the submission
-
Transmission protocol: that is the protocol of the transmission component of the financial department (ERiC)
Creating reports for the german publishing institution “Bundesanzeiger”
From the data collected in the project reports can be created and downloaded for a filing. This functionality can be accessed in the project menu “Send data – Bundesanzeiger”.
The tool to create electronic reports in XBRL format includes a toolbar, here the method of transmission, filters for selecting the data and the client can be selected
Filing options
By pressing the “Test” button, a filing record is generated. Bevor creating the filing record, the submission options must be configured in the submission configuration window, because those settings can have an effect on the transmission.
For a Bundesanzeiger filing the following filing options exist:
-
Filing Period: The period leading the project. This can not be changed.
-
Previous period: If a previous period should be included in the transmission, a period that has been configured in the project, can be selected from the list as the previous period. In a disclosure the transmission of the previous period is always required (this is not required for an opening balance sheet).
Hints for executing the plausibility rules of the Bundesanzeiger
To file and transmit a Bundesanzeiger filing, the filing record has not to match the plausibility rules.
Merely there have been integrated plausbilites in the ReportFactory, which should prevent a substantive incorrect filing.
Preview and check of submission
When creating the XBRL data for submitting, the validity of the data is checked. The test results are displayed in list form in the middle window “Prüfung der Einreichung”.
If a check rule generates a test result, this result is displayed in the list of audit reports. A test message contains the following information:
Examination step: Identification of the examination step in which the error occurred. Examination steps summarize a lot of tests, to group the test results sensefully.
Error type: Type of test message, for example, Warning or error
Test Message: Description of the test results, for example with a description to remove errors.
If a record was created, all the data submission in the preview window is shown below. This gives the transmitter the opportunity, finally to check the complete record to be filed.
Creation of the submission data
If a submission record was generated also the “Einreichungspaket herunterladen” button is active in the tool bar. Pressing this button, the full set of data, which is ready for submission, can be stored in a file. After saving the record, the submission data set can be uploaded to the Bundesanzeigerportal and be published or deposited.
How to submit on Bundesanzeigerportal
The submission on the Bundesanzeigerportal is well described by the local help in individual steps.
This section covers the points that are important in the interaction with the report Factory.
After signing in on Bundesanzeigerportal and it was determined whether a “submission” or “deposit” is carried out, different information must be provided.
In step “Weitere Auftragsdaten” à “Bilanzierungsstandard” you have to select “HGB” an confirm with “OK”.
The report Factory currently provides only the taxonomies for HGB disclosures. If you have to publish other accounting standards such as IFRS for the Bundesanzeiger, please contact us.
To upload the submission produced with the report Factory, select the step “Übermittlung” and “Weitere Datei(en) hochladen”.
In the next window to step “transmitting” click in “A)” on “Browse” and select the submission package created by the report from Factory.
Then select the “B)” “Full accounting documents” and press under “License C)” on the “File (s)”.
Next, select the “D)” the language of filing, and press the “Next” button.
Now you get a preview of your submission and must confirm this. The next steps for the implementation of the submission included detailed explanations, which are matched to the selected settings.
Note that this is a binding and paid submission.
Archiving of submissions
When downloading a submission this is archived by report Factory Server in the subdirectory “filingArchive” of the application data.
| In a single-user version with default directories it is the folder “C: \ Program Data \ ABZ Reporting \ Report Factory \ filingArchive”. |
An archive contains all relevant data submission, and data that is expected in archiving systems. Specifically, these are: (accounts, account assignments, transfers, reclassifications, forms, etc.) of the client, as well as the data. In addition, in the archive file, the following information is stored:
-
Submission ID: a string that uniquely identifies a submission within the report Factory
-
Filing Date: The date and time of submission
-
Submitter: Report Factory user, who pressed the”Submit” button
-
Filing Options: set file options
-
Data of mandates: the output data of the client to create the submission record (client, accounts, account assignments, transfers, reclassifications, forms, form values, etc.)
-
Filing record: to the tax authorities transmitted XBRL data.
-
Checksum of filing record: checksum to verify the integrity of the filing record
-
Preview: Preview Displaying the submission
Create forms
Adjusting forms
Adding new positions
Adding form fields is made possible through a drag and drop function. The position is taken in the form by dragging a position in the outline structure of the taxonomy from the left window to the right window.
The positions in a form can be placed in any order or structure. The exact target position on the form will be displayed during the drag and drop operation by a dotted line. If an item is inserted behind an existing position, the horizontal position of the mouse pointer decides whether the position of the present position is added behind or below (indented). When the cursor is moved - in accordance with the engagement of the existing position - a little further to the right than the existing indentation, then the position will be incorporated under the existing position. If the pointer is placed left from the indentation, the position on the same indentation or at a higher level is inserted.
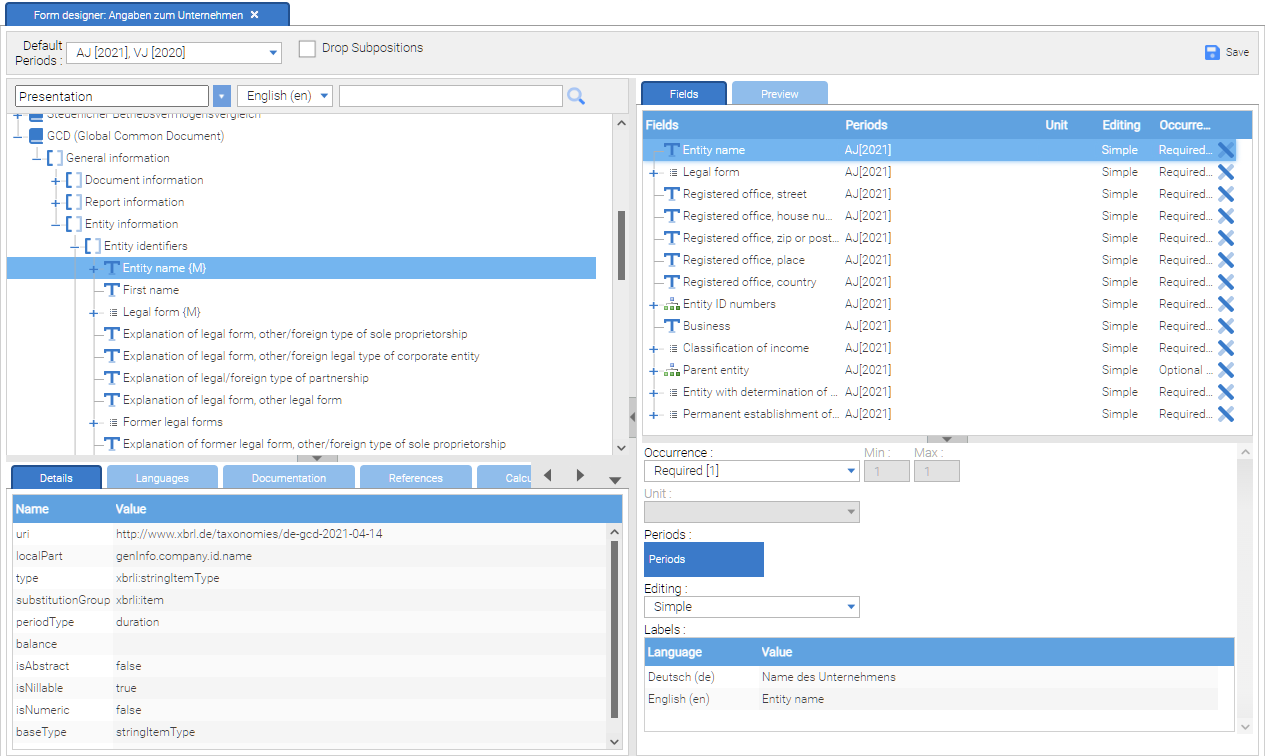
With the “Save” button, the form can be saved so that it can then be used to enter data. When the checkbox “Drop subpositions” is selected, all subpositions are added to the form automatically when adding a new taxonomyposition to a form. That happens in the already existing structure of a taxonomy. The mode “add subpositions” facilitates the creation of circumferential forms, where large areas are covered by outline structures of a taxonomy.
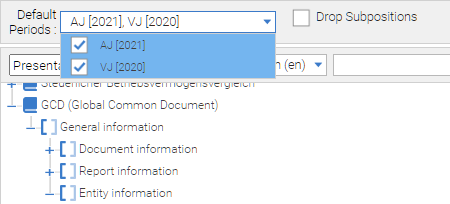
When a form for collecting data from several periods has been configured, then a selection button “default periods” appears in the toolbar, here the existing periods can be enabled or disabled.
Activated periods are always taken as the default values for the periods to be detected (second column in the right window) in the sequence when adding items to a form.
Configuration of an input field
In the window on the right side, the input fields of the form can be configured.
For this, the following information can be given:
-
Occurrence: This determines how many occurrences of a data structure in a form have to generated minimally, and at least and may be generated maximally
-
Unit: unit of the input field, for example, monetary unit
-
Periods: Reporting periods, for which values can be set. When entering, the reporting periods are shown in the columns
-
Edit: specifies the type of formatting with the following values
-
NO: No data acquisition possible, field is only used to structure
-
normal: normal box, depending on the data type of the underlying position
-
multiline: multiple line input for text positions
-
formatted: editing formatted texts into an editor dialog
-
-
Identifier: specifying of custom field names by double clicking on the default name
| If a filled out form field has been deleted, all data gets lost. |
Adjusting tables
By clicking “change form” the first time, a dialog appears, asking you to select a table space from the taxonomy.
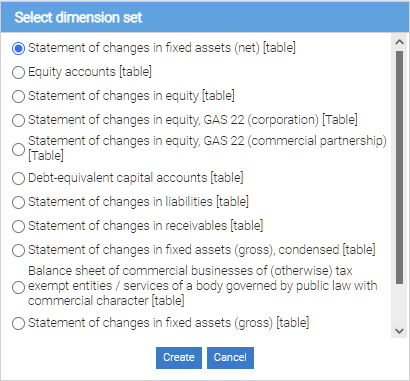
| After selecting the table space, it can not subsequently be changed. For a different table space, a new form must be created. |
After specifying the table space you will see a preview of the table form.
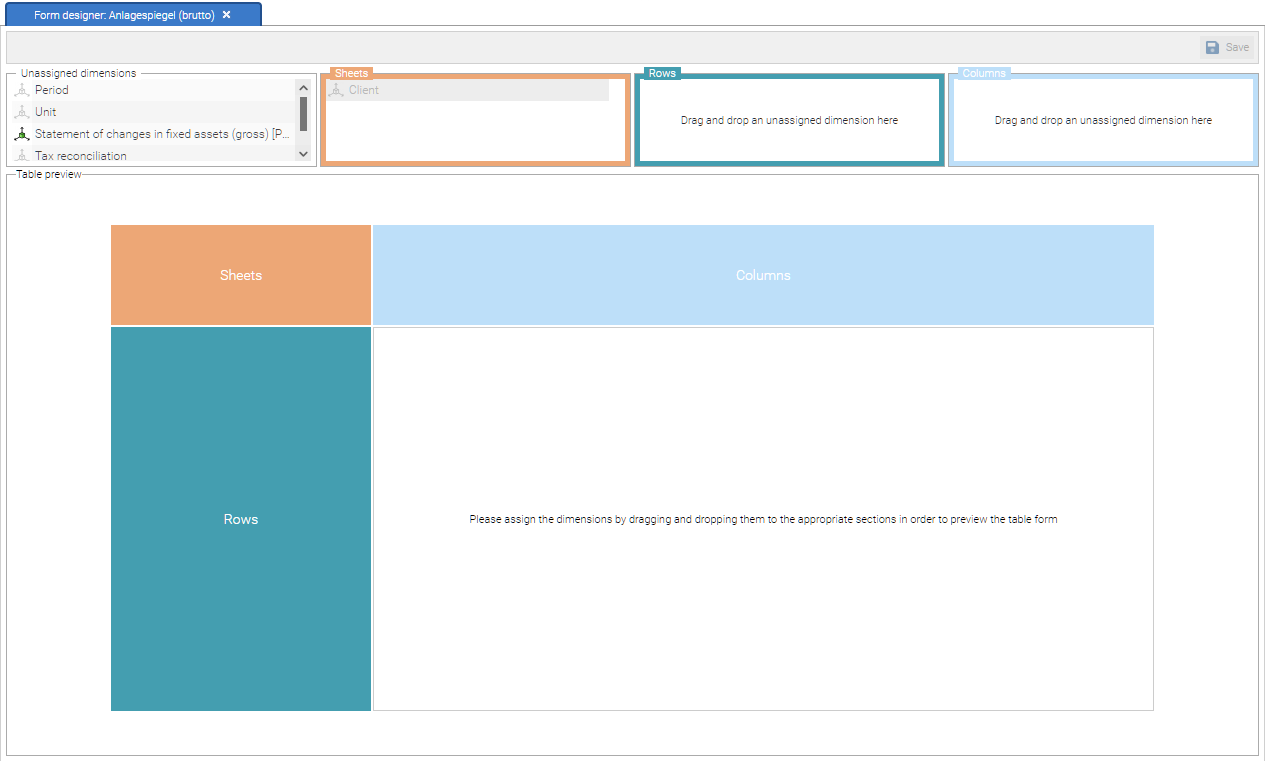
To create the table, drag the dimensions from the “Unassigned dimension” in one of the areas rows, columns or worksheets. Thereby, the dimensions appear as rows, columns, or worksheets.
The table preview is updated and you will be informed whether further action is required .to ensure that at least one dimension, each for rows, columns and worksheets was set.
Once at least one dimension in the fields of rows, columns and worksheets was assigned, the table preview is supplemented by the positions of the associated dimensions. Once all dimensions have been associated with, the table form can be saved.
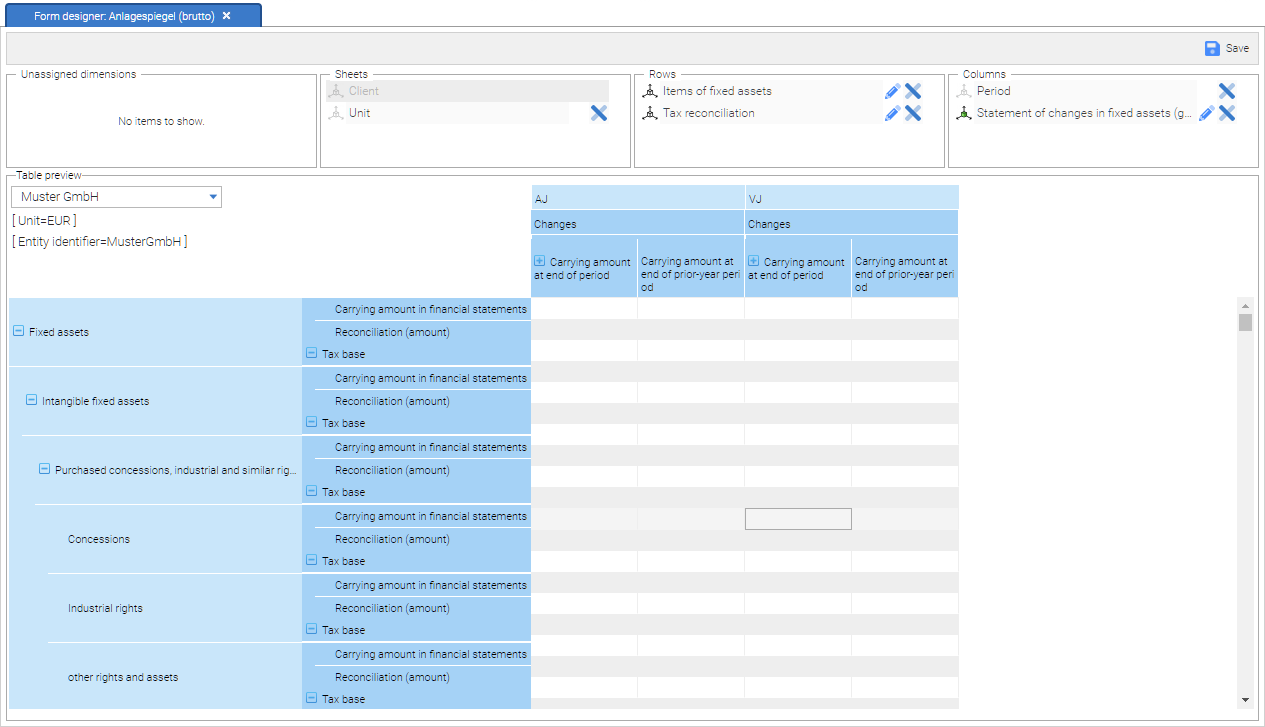
| Dimensions with a position hierarchy (total positions and subordinate positions) can only assigned to the table axes rows and columns. |
To delete the association of a dimension click on the “Remove icon” or drag the dimension to the “Unassigned dimensions”.
The arrangement of positions in table rows columns, and pages are changed by three operations:
-
Moving from one area to another area. For example, the arrangement of positions and subpositions can be transmitted from the line on the column. Or an “open” position with custom values can be drawn to the area “sheets”.
-
By rearranging the dimensions in an area. The positions of the subordinate dimensions in the list subdivide the positions of the overlying dimensions, see illustration below:
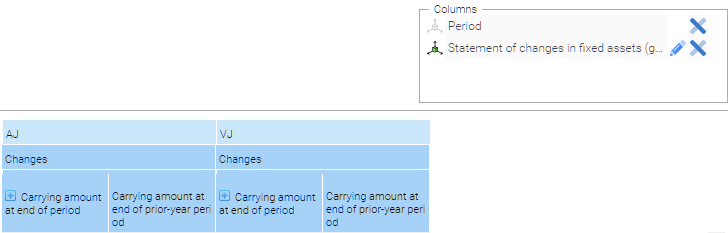
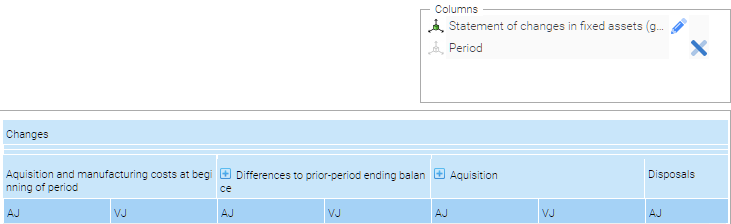
-
By specifying whether the total positions are displayed in first or after the subpositions. This can be changed by selection of the edit icon next to the dimension name.
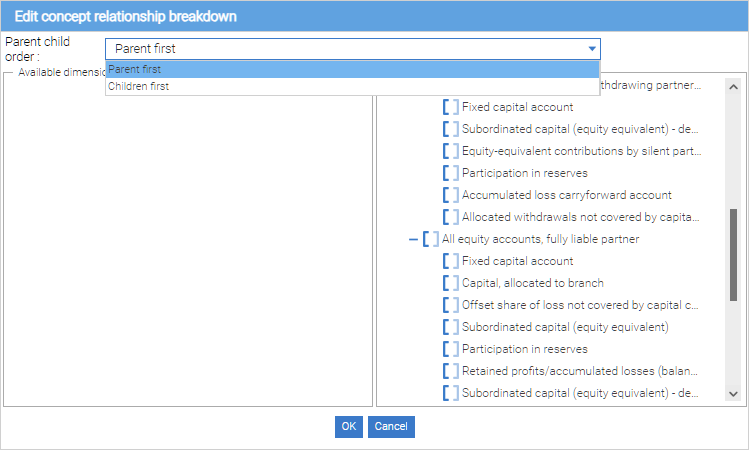
By using the Dimension Editor may also be affected the appearance of the positions and subpositions in the table. To change the structure click on the delete icon in the right pane of the dialog box. This position and subpositions are moved to the right side of “Available positions”. Positions in the left panel can be moved in the right area back to change their arrangement.
After confirming the settings by clicking the OK button, the settings for the table view are applied.
| If an position is removed from the display, to which data has already been collected, this data will be deleted! |
Dimension values
Click to edit the characteristics of a dimension on Dimension edit .In the following dialog select a dimension in the menu selection:
-
by clicking on “add new” new description values can be edit
-
by clicking on the delete icon on the right of a dimension value, this is this deleted

Dimension values can be only acquired for “open” dimensions; those which are not determined by the taxonomy.
Enter data into forms
Save and Reset
The buttons close to the selection lists buttons are used for storing and resetting the forms. By pressing the “Save” button, the current values of a data entry form are saved. All values in the current form will be deleted with the function “clear” and with the “Remove Data” function, all form values are deleted from the database. Executing “Clear” and then executing “Save” has the same effect as the “remove data” function.
Type check
When data acquisition is carried out immediately after that a type test is started. If an invalid value is entered, an exclamation point icon appears next to the input field. When the mouse moves over the icon, an error message with information about the cause of the error is visible.
Entering form data
The input field window contains a tool bar.
In the toolbar the language of the form positions can be adjusted. The number of languages is determined by the used taxonomy.
An entry form allows you to enter data for all clients and to enter commercial law and tax values.
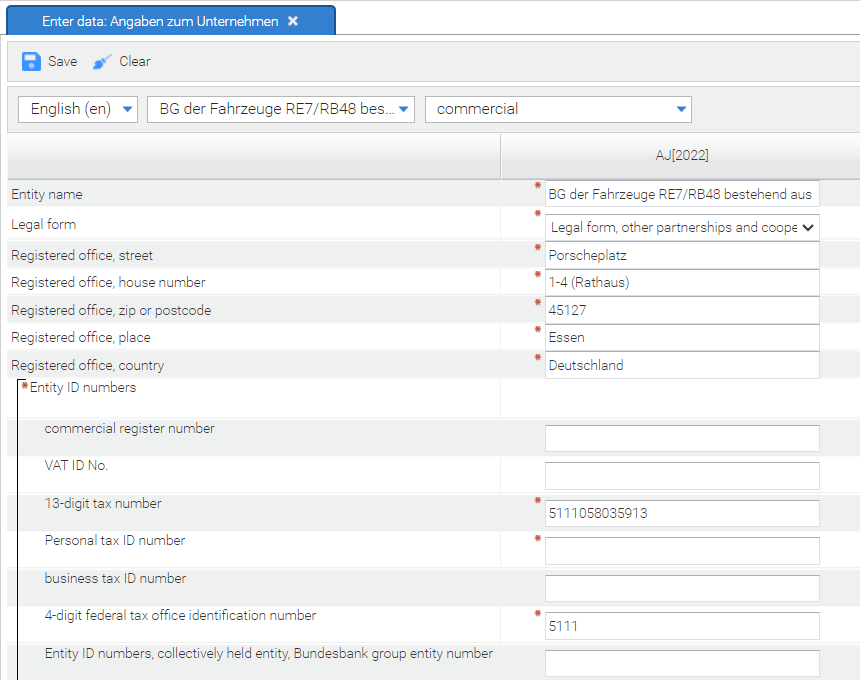
Selection of data type and clients
The second list from the left shows the available clients for which the form has been configured. By selecting a client, the sensed input values are stored in the form of these selected clients. The third selection list allows you to specify whether commercial law or tax values are to be measured.
Caution: When switching between clients or between the commercial and tax form view, previously entered data can be lost when the form has not been saved!
Save and Reset
Individual values of form positions may be removed either by deleting the value in the box or by clicking on the broom icon to the left of the entry box. When entering truth values in a control box, there are three possible values:
-
If this field is checked, this corresponds to the value yes (or true).
-
When the hook was removed, so that the background of the control box is white, then this is equivalent to specifying no (or false).
-
When the hook was removed and the background of the control box is gray, then no value for the position is indicated.
Required Information
Fields in which the entering of data is expected, are marked with a star symbol. If no values are entered in these input fields, the form can still be saved. After entering invalid values in an entering field, these values are removed when saving.
Input of data structures
“Belong together information” in a data structure are represented by square brackets on the left side. For data structures, the possibility exists , to produce several versions. Additional characteristics of a data structure can be created by clicking the “+” symbol. Superfluous data structures can be removed again by clicking on the “-“ symbol.
Entering table data
To enter data in a table form, click on a cell in the table.
There are two ways for entering data in tables. By importitng data using a CSV file or by entering it manually.
CSV table data import
| The functionality described below is currently only supported for the Statement of changes in assets table |
You can automatically populate table data by importing a CSV file exported from your accounting system containing either:
-
the IDs of the positions or
-
the account names that have been mapped to the positions
that represent the rows of the table, the IDs of the positions that represent the table columns as well as the table cell values.
To import the table data:
-
Open the Table editor by clicking Edit in the Forms section of the ribbon
-
Select the table in the dialog that will appear and click Open
-
Click Import CSV in the Table editor toolbar
-
In the dialog that will appear specify:
-
the CSV file used for import
-
the import template
-
The Diamant import template can be downloaded here
-
-
the ledger that should be used to associate the account names provided in the import CSV to the actual positions used as table rows
-
-
Click Import to import the data or Cancel to abort the operation
Upon completion of the import process, the table is populated with the values provided in the CSV file and it behaves as if the data were entered manually (i.e. totals can be calculated automatically if the appropriate options is selected, values can be added\modified\deleted manually, the table contents can be saved)
| Importing table data via CSV will overwrite any existing table data |
| CSV importing is only supported for tables that have an exactly defined period (i.e. where the period is not ANY) |
| Contact us at support@abz-reporting.com to obtain the import template that would be compatible with the CSV file exported from your accounting system |
Totals calculation
Totals calculation enables values for subposition to be summed up. In order to use this feature, enable a checkbox “Totals calculation” and confirm the following dialog “Please note that values of totals positions might be changed if they are calculated by filled subposition values. Do you want to proceed?”.
Summation occurs along rows and columns and totals of a cell have to be equal along rows and columns contributing to the total.
Cell, that got value as a result of summation, are not editable and grayed. By clicking on it, you can see which cells are contributing to the value of that cell. By hovering on it, you get a message “Automatically calculated totals cannot be modified”.
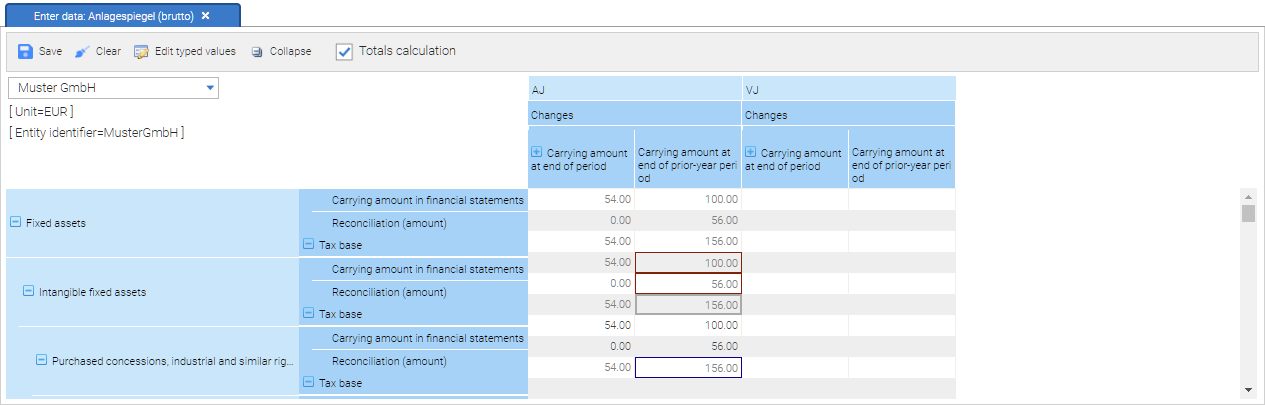
In case sums are not equal for both rows and colums, an error message appears in a cell. By clicking on it, you can see which cells are contributing to the sum and therefore easily find why the sums are not the same along both rows and columns. By hovering on it, you get a message “The provided values sum up to different totals across rows and columns”.
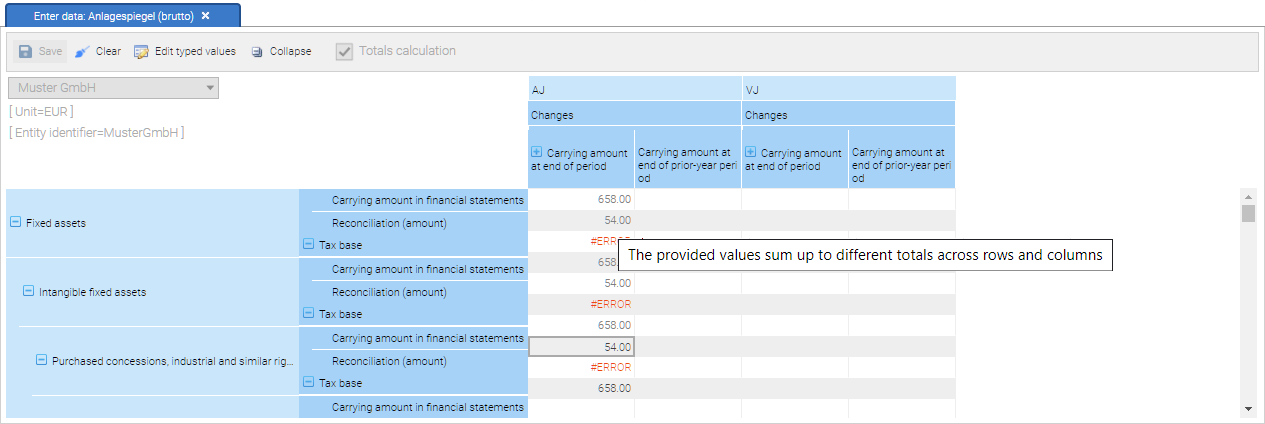
Manually entering data
When totals calculation is disabled you can manually enter data in all cells of the table.
Please disable checkbox “Totals calculation” to manually enter data. Then simply enter values in cells by clicking on them.
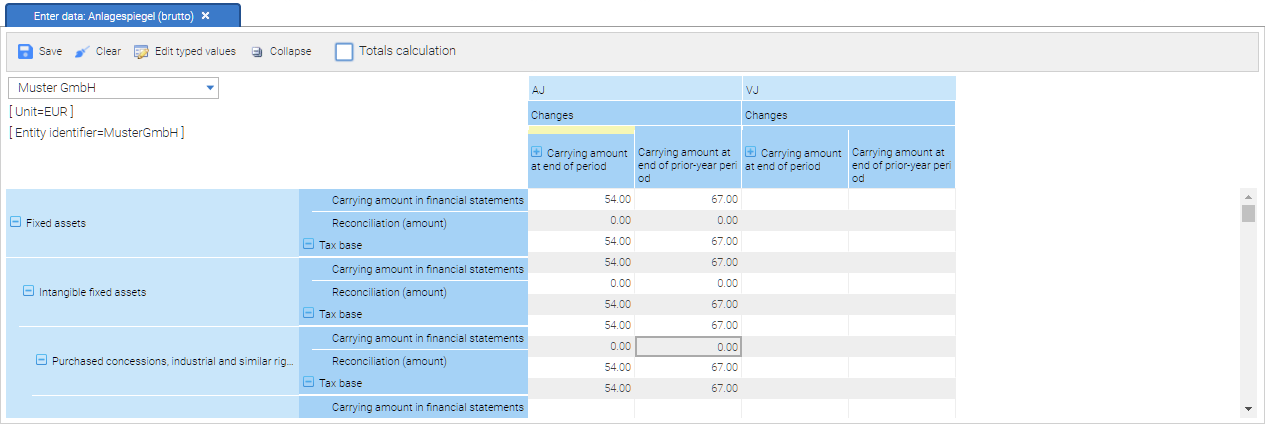
To change the worksheets, select a value in a pick list in the upper left corner of the screen, below the toolbar. Thus, the entered values in the table are associated with the worksheet for that dimension (for example, the client).
If the same table must be filled with information of two different clients, first select the first client in the selection list, enter the data and select then the second client and enter again the values.
You can make editing of large tables easier by:
-
clicking the Collapse button in the tool bar. This will hide all blank rows and columns (i.e. all rows and columns that don’t contain at least one filled cell). Once collapsed, you can revert back to the original view by clicking the Expand button in the toolbar
-
collapsing and expanding positions via the explorer like icons next to the position labels on the horizontal and vertical headers of the table. Collapsing a position this way will hide all of its sub-positions and the appropriate rows or columns regardless of whether they contain data or not. You can identify a collapsed position by the + icon next to its label as well as the yellow highlight on top of it (for the positions in the horizontal header position) or on the side of it (for the vertical header positions). Expanded positions are identified by the - icon next to their label and positions that don’t contain sub-positions (i.e. that cannot be collapsed or expanded) have no icons next to their label
Click to edit the characteristics of a dimension “Dimension edit” .In the following dialog select a dimension in the menu selection:
-
by “add new” you can add a description for new values
-
by clicking the delete icon to the right of a dimension the value is this deleted
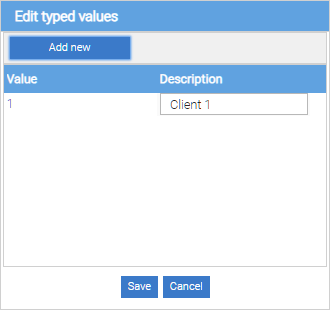
Dimension values can be edit only for “open” dimensions, which are not determined by the taxonomy. After saving the changes, the table is updated. The updated dimension values and their descriptions appear in the selection lists.
Project Import & Export
With the project export function, the current project can be saved outside of the report Factorye and with the project import a project can be revert back to a previous state or be imported under a new project name.
The exchange of a project between different installations of the Report Factory is possible in this way.
Project export
With the menu function “Export Project” the export dialog can be accessed. The user has to be administrator of the project to export a project.
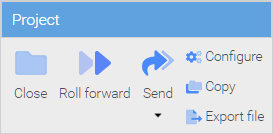
The export dialog shows a multiline interface. Here you can insert a description of the export.
Additionally, two save options are shown:
-
Leave on server : If the checkbox is hooked the export is placed on a server directory
-
Download local copy: If that checkbox is hooked, the export is downloaded to a local directory.
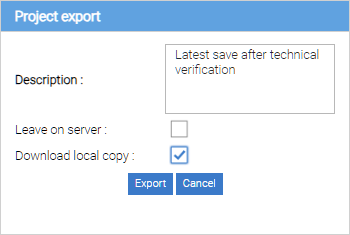
By pressing “export” the export process is started.
Project import
By clicking on “Import Project” in the main menu, the import dialog is opened.
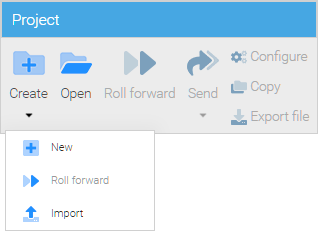
The import section is divided in two parts. In the upper section, a previous, local exported project can be uploaded to the ReportFactory server. Therefore you have to choose the file via “Choose file” and search for the right project in the upcoming dialog. After that the project can be uploaded – by pressing uplpad. Now the project is ready to import. In the lower section you can see a table of all project exports, which are available on the server. By selecting the specific export it can be imported, deleted or downloaded – this can be done by clicking of one of the buttons.
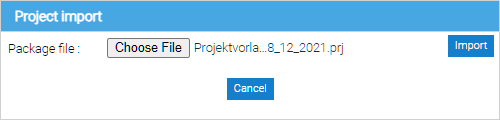
-
By clicking “Import” the import process is started. If there is already a project with the same project name exisiting in the ReportFactory, you will be asked to overwrite or to copy it with a new name.
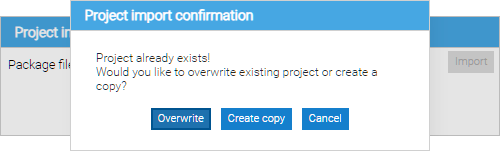
| If the browser is closed during an import process, it will be cancelled. |
Taxonomy replacement
| Please make a project export before changing the taxonomy |
The ReportFactory offers the opportunity to change the taxonomy of a fact collection, with acquisition of compatible data.
| Starting from the HGB taxonomy version 5.0 it is possible to change the taxonomies with newer versions. |
Hereby the maintenance of a variant (core industries, banks, insurance companies) is necessary, for example, Replacing the HGB Kerntaxonomie 5.0 with the HGB Kerntaxonomie 5.1.
Perform a replacement
To replace the taxonomy the project configuration has to be opened (tab taxonomy). By clicking in the left box on the line with the desired target taxonomy ,this is selected and added by pressing the “Add” button to the available taxonomies in the project.
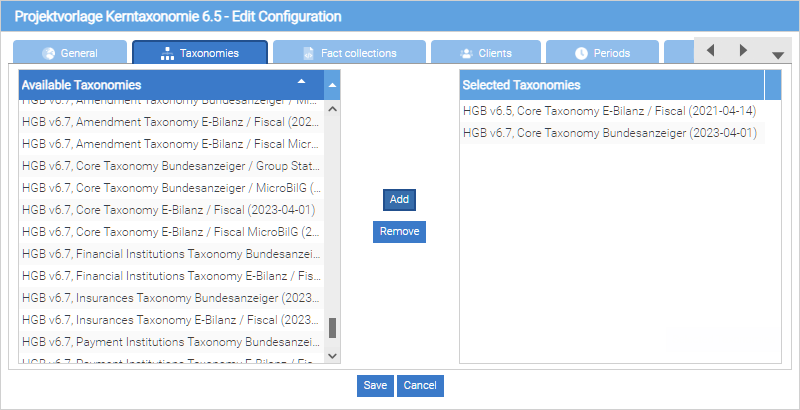
After that the tab fact collections has to be opened. By double clicking on the row of the desired collection of facts it is opened for editing. In the “taxonomy” column can now the previously added taxonomy be selected.
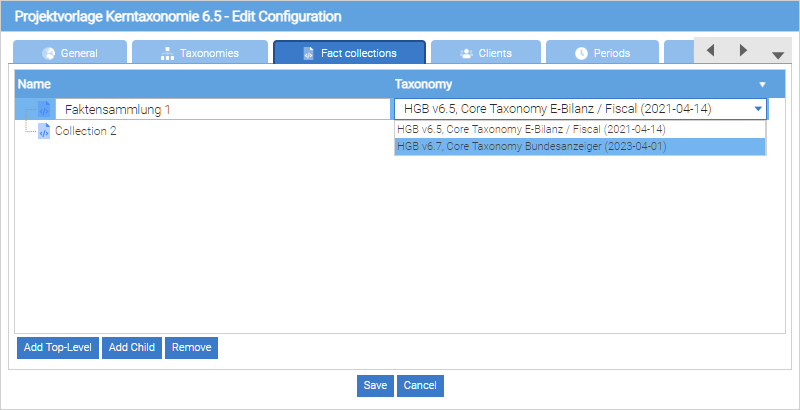
By pressing save, the exchange process is started.
| Referring to the size of data the exchange process can last several minutes. |
If data for the new Taxonomieversion could not be applied, a report is displayed, describing the individual effects.
After the taxonomy change, the old taxonomy has to be removed from the project. For this, go the project configuration and open the tab “taxonomies” again. In the right box the old taxonomy must be selected and by clicking the “Remove” button it is removed from the project. By pressing the “Save” button, the change is adopted.
Preparing a project for next reporting period
Duplicating a report project
To duplicate a project it must be open. Likewise, the user must be administrator of the project (see report Managing Projects) and must have the general right to create new projects (see installation and running ReportFactory). If the menu item “Create copy” is grayed out, the user does not have the required permissions.
“Create a copy” by selecting the menu item in the Project menu it opens the dialog to duplicate the project.

In the following dialog the new project name has to entered and by pressing the “Copy” button an exact copy of the current project can be created.
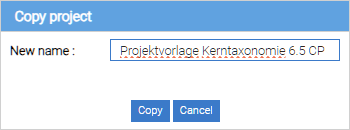
| If the browser window gets closed during the copying process, the process is canceled. |
Roll-forward project to next period
If a report project shall be used for a following reporting period and / or a following the taxonomy version shall be changed, this is also supported through the ReportFactory.
To use this functionality, the initial project must be open. Likewise, the user must have administrator rights and must have the general right to create new projects). If the menu item “Roll forward” is grayed out, the user does not have the required permissions.
“Roll forward” by selecting the menu item is starting the update process.
In the dialog box, enter the name of the forwarded copy. By pressing the “Next” button you get to the next dialog.
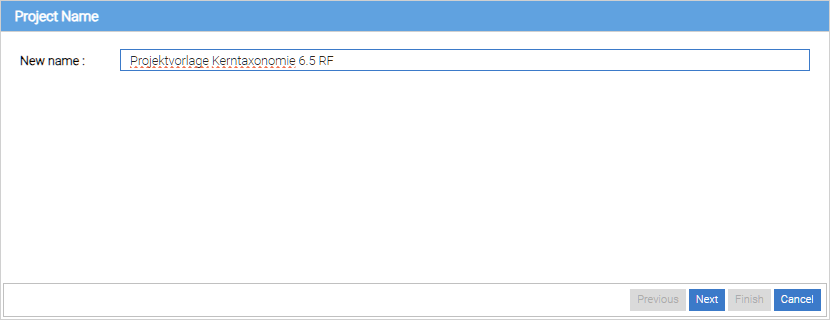
Press the button “Next” to go to the next dialog.
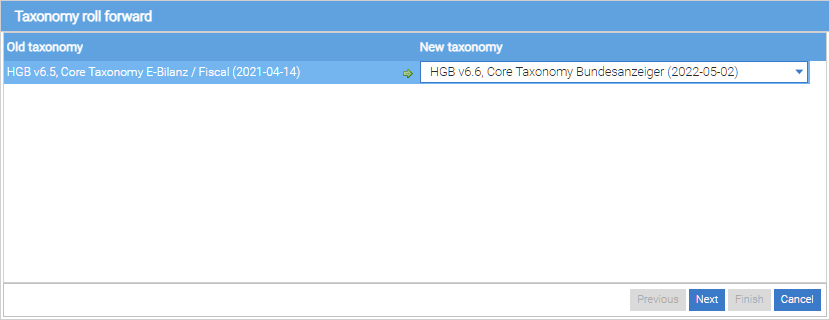
Press the button “Next” to go to the next dialog.
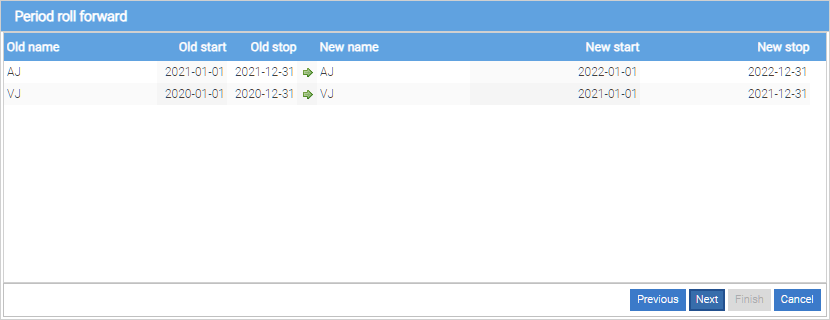
Press the button “Next” to go to the next dialog.
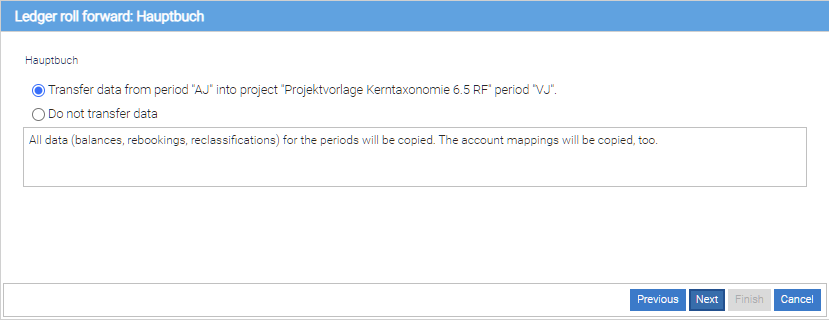
Press the button “Next” to go to the next dialog.
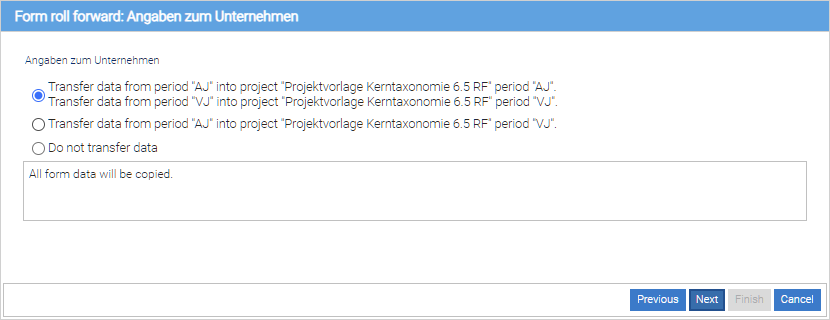
Press the button “Next” to go to the next dialog.
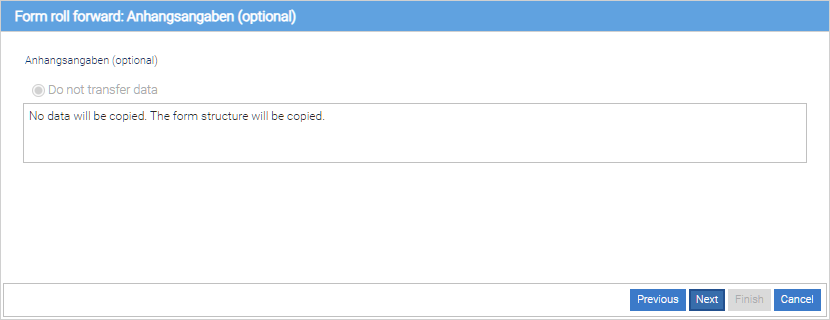
By pressing the “Finish” button the copying process is executed.
You will see a progress bar that remains visible for the entire duration of the copying process. The copy process may take several minutes depending on the size of the project.
After finishing the progress the project can be opened and used.
| If the browser window is closed during continuous writing, the process is canceled. |
Project templates
Using project templates
At the wikipage “ReportFactory Projektvorlagen” exported projects are provided that can be used as a starting point for an e-balance submission.
The projects can be used through importing those (see Project Export and Import) to the ReportFactory.
Using the “Clone form” tab, (see Report Project Managmenet) only static data forms from the project template is copied into another project.
Browser compatibility
The user interface of the ReportFactory is (with the exception of the Office Addins) browser-based. The use of internet browsers as an user interface for applications has many advantages (for example no installation on the user computers is required in the multi-user version) - but of course there can be disadvantages.
| Updating web browsers can lead to incompatibilities, resulting, the use of some components can be more difficult or impossible. |
The ABZ Reporting GmbH is updating the ReportFactory in short intervals in order to avoid incompatibilities with new browser versions.
| We recommend a regular updating of the ReportFactory installation to avoid browser incompatibilities and to have the latest taxonomy version included . |
The regular installation of software updates in short intervals is not possible in all companies and is partly carried out in favor of lower maintenance costs over long time intervals. This problem can lead to a bunch of problems, because new browser versions can have a new structure which doesn’t support the requirements of an older reportfactory version.
An alternative to avoid that problem is the use and installation of the browser Firefox ESR. The Firefox ESR is a special variant of the Firefox browser, in which the compatibility is paramount and browser updates are provided primarily for security updates.
| If you encounter problems in the browser surface, you can use the browser version described in the following section – with those problems can be avoided purposefully. |
Version |
Windows |
Windows |
Linux |
Linux |
ReportFactory Version 1.3 |
||||
ReportFactory Version 1.4 |
||||
ReportFactory Version 1.5 |
||||
ReportFactory Version 1.6 |
||||
ReportFactory Version 1.7 |
||||
ReportFactory Version 1.8 |
||||
ReportFactory Version 1.9 |
||||
ReportFactory Version 1.10 |
||||
ReportFactory Version 1.11 |
||||
ReportFactory Version 1.12 |
||||
ReportFactory Version 1.13 |
||||
ReportFactory Version 1.14 |
||||
ReportFactory Version 1.15 |
||||
ReportFactory Version 1.16 |
||||
ReportFactory Version 1.17 |
||||
ReportFactory Version 1.18 |
||||
ReportFactory Version 1.19 |
||||
ReportFactory Version 1.20 |
||||
ReportFactory Version 1.21 |
||||
ReportFactory Version 1.22 |
||||
ReportFactory Version 1.23 |
||||
ReportFactory Version 1.24 |
||||
ReportFactory Version 1.25 |
||||
ReportFactory Version 1.26 |
||||
ReportFactory Version 1.27 |
||||
ReportFactory Version 1.28 |
||||
ReportFactory Version 1.29 |
||||
ReportFactory Version 1.30 |
||||
ReportFactory Version 1.31 |
||||
ReportFactory Version 1.32 |
||||
ReportFactory Version 1.33 |
||||
ReportFactory Version 1.34 |
||||
ReportFactory Version 1.35 |
||||
ReportFactory Version 1.36 |
||||
ReportFactory Version 1.37 |
||||
ReportFactory Version 2.0 |
Installation of Firefox ESR
Hereinafter the installation of Firefox ESR (Extended Support Release) is described. The installation description is constructed in a way, that this browser can be installed in addition to existing browsers without causing side effects, for example through the use of an existing browser profile or plugins.
Please select the specific download address - depending on your report Factory version, the existing operating system and the desired language for the browser.
Then start the installer and follow the instructions in the installation manual.
Advantages of using Firefox ESR
The list summarizes the main advantages for using a Firefox ESR.
-
By updating the Firefox ESR, it does not automatically switch to the next version of the browser, but preserve the existing browser version and fix known browser problems.
-
The Firefox ESR can be installed independently of the current browser version (plugins, updates, etc.). Thereby, typical, resulting in multiple installed parallel browsers problems are avoided (for example, the re-use of user profiles or undesirable side effects caused by existing browser plugins).
-
With browser-based problems shortly before a filing deadline, the ESR provides a reliable alternative browser.
-
Consultants and partners have a stable browser version for software presentations or use in numerous customer projects, so that the report Factory use can not be adversely affected by the updates to the existing browser on the system.
| Please note that use of the Firefox ESR does not replace the software updates of the Report Factory, with which additional functions and new taxonomy versions are provided. |